- Production of Crude Oil
Crude oil production[1] during October,2020 was2567.70 TMT which is7.10% lower than target and6.24% lower when compared with October2019.Cumulative crude oil production during April-October, 2020 was 17940.49 TMT which is 5.0% and 6.12% lower than target for the period and production during corresponding period of last year respectively.Unit-wise and State-wise crude oil production is given at Annexure-I. Unit-wise crude oil production for the month of October, 2020 and cumulatively for the period April-October, 2020 vis-à-vis same period of last year has been shown in Table-1 and month-wise in Figure-1.
Table-1: Crude Oil Production (in TMT)
|
Oil Company
|
Target
|
October (Month)
|
April-October (Cumulative)
|
|
2020-21 (Apr-Mar)
|
2020-21
|
2019-20
|
% over last year
|
2020-21
|
2019-20
|
% over last year
|
|
Target
|
Prod.*
|
Prod.
|
Target
|
Prod.*
|
Prod.
|
|
ONGC
|
20931.54
|
1784.43
|
1707.03
|
1712.95
|
99.65
|
12283.81
|
11860.92
|
11965.08
|
99.13
|
|
OIL
|
3268.00
|
279.92
|
256.73
|
272.57
|
94.19
|
1841.94
|
1742.14
|
1886.83
|
92.33
|
|
PSC Fields
|
8265.00
|
699.45
|
603.95
|
752.94
|
80.21
|
4759.52
|
4337.42
|
5258.52
|
82.48
|
|
Total
|
32464.53
|
2763.80
|
2567.70
|
2738.46
|
93.76
|
18885.27
|
17940.49
|
19110.43
|
93.88
|
Note: 1. Target for the year 2020-21 is provisional, subject to finalization. *: Provisional
2. Totals may not tally due to rounding off.
Figure-1: Monthly Crude Oil Production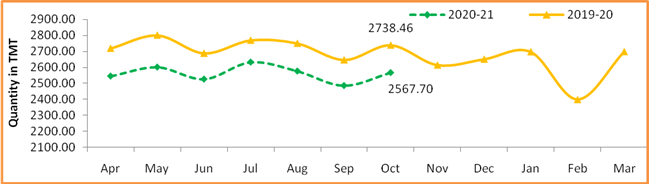
Unit-wise production details with reasons for shortfall are as under:
-
- Crude oil production by ONGC in nomination block during October, 2020 was 1707.03 TMT which is 4.34%lower than target and0.35%lower when compared with October 2019. Cumulative crude oil production by ONGC during April-October, 2020 was 11860.92 TMT which is 3.44%and 0.87% lower than target for the period andproduction during corresponding period of last year respectively. Reasons for shortfall in production are as under:
- Production planned from WO16 cluster could not be realized due to delay in MOPU (Sagar Samrat) as activities at GPC yard Abu Dhabi got affected due to Covid restrictions/lockdown
- Production planned from new wells in Ratna field affected due to non- availability of Electrical Submersible Pumps for well completion due to implications of COVID-19
- New wells planned under Cluster 8 development project delayed due to toppling of D-30-2 platform jacket during installation and further delay in installation of new platforms due to COVID implications.
-
- Crude oil production by OIL in the nominationblock during October, 2020 was256.73 TMT which is 8.28% lower than the monthly target and 5.81% lower than the October, 2019. Cumulative crude oil production by OIL during April-October, 2020 was 1742.14 TMT which is 5.42% and 7.67% lower than target for the period and production during corresponding period of last year respectively. Reasons for shortfall in production are as under:
- Less than planned contribution from workover wells, drilling wells and old wells.
- Rise in water cut and decline in liquid production from existing wells.
- Bandhs /blockade by local people and associations etc. after the Baghjan Blowout, protests/agitation etc.
-
- Crude oil production by Pvt/JVscompanies in the PSC (production sharing contract) regime during October,2020 was 603.95 TMT which islower by 13.65% than the monthly target and 19.79%lowerthanOctober, 2019.Cumulative crude oil production by Pvt/JVs companies during April-October, 2020 was 4337.42 TMT which is 8.87% and 17.52% lower than target for the period and production during corresponding period of last year respectively.Reasons for shortfall in production are as under:
- RJ-ON-90/1(CEIL): (1) Mangala: - Major elements brought online in the last week of October, Slug catcher and sections of productions lines are to be hooked up. (2) Bhagyam: Artificial lift malfunction. Delayed polymer injection. Addl. Downtime-Over Head Line/Grid failures. (3) Aishwarya: Delayed polymer injection. Additional downtime due to Electrical Submersible Pump failures in few wells. (4) ABH: Delay in hook-up of ABH Stage-2 wells. (5) Satellite Fields: Failure or flow cease in few wells. (6) Tukaram & Kaam-1: Well and Surface Facility construction schedule impacted by COVID-19.
- RAVVA (CEIL): Ullage problem due to Production reduced causing kink in Hose pipe in Aug-2020. Production reduced by 50% for few days in October 2020. Rectification job ongoing.
- CB-ONN-2003/1 (ONGC): Deviation due to non-acceptance of crude by Off the Shelf (OTS) Ravva (ullage problem).
- CB-ONN-2000/1 (GSPC): Well PK#2 became non-producing in Dec-2019 due to possible casing damage and reservoir issues. Well SE_DEV#1, SE#1A and SE1#A1 is shut-in due to unavailability of effective demulsifier to break tight water and oil emulsion.
- CY-ONN-2002/2 (ONGC): Well MDDD couldn't be drilled and completed because of local agitation.
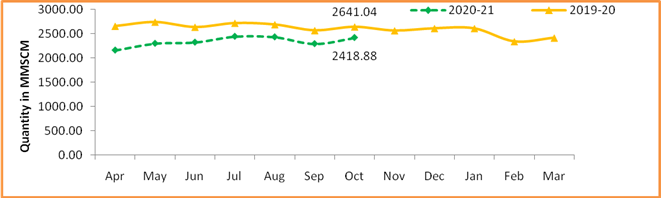
- Production of Natural Gas
Natural gas production during October,2020 was 2418.88MMSCM which is 18.20% lower than the monthly target and 8.41% lower when compared with October, 2019. Cumulative natural gas production during April-October, 2020 was 16372.77MMSCM which is 13.90% and 12.19% lower than target for the period and production during corresponding period of last year respectively. Unit-wise and state-wise natural gas production is given at Annexure-II. Unit-wise natural gas production for the month of October, 2020 and cumulatively for the period April-October, 2020 vis-à-vis same period of last year has been shown in Table-2 and month-wise in Figure-2.
Table-2: Natural Gas Production (inMMSCM)
|
Oil Company
|
Target
|
October (Month)
|
April-October (Cumulative)
|
|
2020-21 (Apr-Mar)
|
2020-21
|
2019-20
|
% over last year
|
2020-21
|
2019-20
|
% over last year
|
|
Target
|
Prod.*
|
Prod.
|
Target
|
Prod.*
|
Prod.
|
|
ONGC
|
24437.08
|
2061.06
|
1883.75
|
1954.35
|
96.39
|
14293.51
|
12863.07
|
14026.06
|
91.71
|
|
OIL
|
3181.54
|
289.74
|
222.48
|
239.23
|
93.00
|
1850.13
|
1464.28
|
1623.61
|
90.19
|
|
PSC Fields
|
6826.82
|
606.20
|
312.64
|
447.46
|
69.87
|
2871.99
|
2045.42
|
2996.49
|
68.26
|
|
Total
|
34445.44
|
2957.00
|
2418.88
|
2641.04
|
91.59
|
19015.63
|
16372.77
|
18646.15
|
87.81
|
Note: 1. Target for the year 2020-21 is provisional, subject to finalization. *: Provisional
2. Totals may not tally due to rounding off.
Figure-2: Monthly Natural Gas Production
-
- Natural gas production by ONGC in the nominationblocks during October, 2020 was 1883.75MMSCM which is 8.60% lower than target and 3.61% lower when compared with October 2019. Cumulative natural gas production by ONGC duringApril-October, 2020 was 12863.07 MMSCM which is 10.01% and 8.29% lower than target for the period and production during corresponding period of last year respectively.Reasons for shortfall in production are as under:
- Closure of Gas wells in western offshore due to Hazira Plant shutdown on 24.09.20 and subsequent normalization.
- Less Gas production from WO16 cluster due to delay in MOPU and non-realization of gain planned from new subsea wells in Bassein field due to delay in subsea umbilical connections/hook up jobs in view of Covid-19 implications.
- Less than planned production from Vasistha/S1 wells in EOA due certain reservoir related issues.
-
- Natural gas production by OILin the nomination block during October, 2020 was 222.48 MMSCM which is 23.21% lower than monthly target and 7.0% lower than October, 2019. Cumulative natural gas production by OIL during April-October, 2020 was 1464.28 MMSCM which is 20.85% and 9.81% lower than target for the period and production during corresponding period of last year respectively. Reasons for shortfall in production are as under:
- Low upliftment/demand of gas by the major customers.
- Bandhs /blockade by local people and associations etc. after the Baghjan Blowout, protests/agitation etc.
-
- Natural gas production by Pvt/JVs companiesin the PSC (production sharing contracts) regime during October,2020 was 312.64MMSCM which is 48.43% lowerthan monthly target and30.13% lower than October, 2019. Cumulative natural gas production by Pvt/JVs during April-October, 2020 was 2045.42MMSCM which is 28.78% and 31.74% lower than target for the period and production during corresponding period of last year respectively. Reasons for shortfall in production are as under:
- KG-DWN-98/3 (RIL): D-34 production commencement delayed due to COVID 19 pandemic. Production expected to commence in Nov End ’2020.
- RJ-ON/6 (FEL): Power Plant customer has further reduced gas off take as one of the Gas turbine is on emergency shutdown.
- RJ-ON-90/1 (CEIL): RDG - Delay in new Raageshwari Deep Gas (RDG) start up due to Covid-19.
- KG-DWN-98/2 (ONGC): Less Gas production from well due to reduction of choke. (ONGC)
- Raniganj East (ESSAR): Production curtailed due to limited sales off-take.
- Crude Oil Processed (Crude Throughput)
Crude Oil Processed during October, 2020 was 18389.27TMT which is 15.26% lower than the target for the month and16.13% lowerwhen compared with October, 2019. Cumulative crude throughput during April-October, 2020 was118555.33 TMT which is 18.41% and 19.71% lower than target for the period and crude throughput during corresponding period of last year respectively.Refinery-wise details of the crude throughput and capacity utilization during the month of October, 2020 vis-à-vis October, 2019 are given at Annexures-III and Annexures -IV. Company-wise crude throughput for the month of October, 2020 and cumulatively for the period April-October, 2020vis-à-vis same period of last year has been shown in Table-3 and month-wise in Figure-3.
Table 3: Crude Oil Processed(Crude Throughput) (in TMT)
|
Oil Company
|
Target
|
October (Month)
|
April-October (Cumulative)
|
|
2020-21 (Apr-Mar)
|
2020-21
|
2019-20
|
% over last year
|
2020-21
|
2019-20
|
% over last year
|
|
Target
|
Prod.*
|
Prod.
|
Target
|
Prod.*
|
Prod.
|
|
CPSE
|
148031.12
|
12782.65
|
10763.45
|
12473.31
|
86.29
|
84186.56
|
65396.27
|
83657.71
|
78.17
|
|
IOCL
|
72499.86
|
6565.53
|
5662.06
|
6042.68
|
93.70
|
41651.68
|
32561.32
|
40862.90
|
79.68
|
|
BPCL
|
30499.95
|
2733.57
|
2116.95
|
2679.46
|
79.01
|
17888.79
|
12781.12
|
17884.98
|
71.46
|
|
HPCL
|
17867.47
|
918.94
|
1288.84
|
1388.35
|
92.83
|
10107.83
|
9321.98
|
9872.82
|
94.42
|
|
CPCL
|
9000.00
|
930.00
|
725.26
|
711.09
|
101.99
|
4470.00
|
4108.58
|
5899.85
|
69.64
|
|
NRL
|
2700.00
|
229.00
|
232.23
|
246.41
|
94.24
|
1582.00
|
1500.61
|
1640.77
|
91.46
|
|
MRPL
|
15400.00
|
1400.00
|
731.02
|
1397.96
|
52.29
|
8450.00
|
5077.96
|
7445.37
|
68.20
|
|
ONGC
|
63.83
|
5.61
|
7.10
|
7.37
|
96.36
|
36.27
|
44.70
|
51.02
|
87.62
|
|
JVs
|
14772.00
|
1236.00
|
1599.32
|
1771.04
|
90.30
|
8535.00
|
9239.89
|
11411.12
|
80.97
|
|
BORL
|
7800.00
|
660.00
|
561.14
|
666.67
|
84.17
|
4560.00
|
3072.32
|
4445.74
|
69.11
|
|
HMEL
|
6972.00
|
576.00
|
1038.18
|
1104.36
|
94.01
|
3975.00
|
6167.58
|
6965.39
|
88.55
|
|
Private
|
89515.16
|
7681.81
|
6026.50
|
7681.81
|
78.45
|
52585.59
|
43919.17
|
52585.59
|
83.52
|
|
RIL
|
68894.99
|
5897.66
|
5463.71
|
5897.66
|
92.64
|
40400.68
|
34440.56
|
40400.67
|
85.25
|
|
NEL
|
20620.18
|
1784.16
|
562.79
|
1784.16
|
31.54
|
12184.92
|
9478.61
|
12184.92
|
77.79
|
|
TOTAL
|
252318.28
|
21700.46
|
18389.27
|
21926.16
|
83.87
|
145307.16
|
118555.33
|
147654.43
|
80.29
|
Note: 1. Target for the year 2020-21 is provisional, subject to finalization. *: Provisional
2. Totals may not tally due to rounding off.
Figure 3: Crude Oil Processed (Crude Throughput) 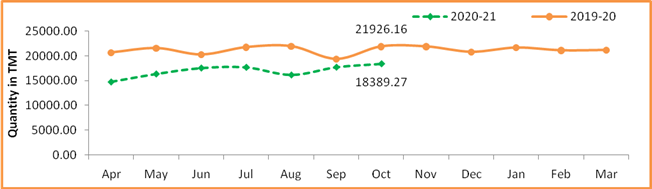
3.1 CPSE Refineries’ crude oil processed during October, 2020 was 10763.45TMT which is 15.80% lower than the target for the month and13.71%lowerwhen compared with October, 2019.Cumulative crude throughputby CPSE refineries during April-October, 2020 was 65396.27TMT which is 22.32% and 21.83% lower than target for the period and crude throughputduring corresponding period of last year respectively.Reasons for shortfall in production are as under:
- IOCL-Barauni, Koyali, Haldia, Mathura, Panipat and Paradip: Crude processed regulated for low product demand due to COVID impact.
- HPCL-Mumbai: Crude processed lower due to major power disturbance in Mumbai resulting in shutdown of primary and secondary units.
- HPCL-Visakh: Crude processed lower due to unplanned shutdown of secondary unit.
- CPCL-Manali &MRPL-Mangalore: Crude processed lower due to Lower demand due to impact of COVID-19 lockdown.
3.2 JV refineries’ crude oil processed during October, 2020 was 1599.32TMT which is 29.39% higher than the target for the month but 9.70% lower when compared with October, 2019. Cumulative crude throughput during April-October, 2020 was9239.89 TMT which is 8.26% higher than target for the period but19.03% lower when compare with the corresponding period of last year respectively.
3.3 Private refineries’ crude oil processed during October, 2020 was 6026.50TMT which is 21.55% lower than the corresponding month of last year. Cumulative crude throughputduring April-October, 2020 was 43919.17 TMT which is 16.48% lower than thecorresponding period of last year.
- Production of Petroleum Products
Production of Petroleum Products during October, 2020 was 18876.54 TMT which is 15.44% lower than the target for the month and 16.97% lower when compared with October, 2019. Cumulative production during April-October, 2020 was 126165.06 TMT which is 14.97% and 16.37% lower than target for the period and production during corresponding period of last year respectively. Unit-wise production of petroleum products is given at Annexure-V. Company-wise production for the month of October, 2020 and cumulatively for the period April-October, 2020 vis-à-Vis same period of last year has been shown in Table-4 and month-wise in Figure-4.
-
- Production of petroleum Products by Oil’s Refineries during October, 2020 was 18513.65 TMT which is 15.59% lower than the target for the month and 17.07% lower when compared with October, 2019. Cumulative production of petroleum products by refineries during April-October, 2020 was 123714.97 TMT which is 15.07% and 16.45% lower than target for the period and production during corresponding period of last year respectively.
-
- Production of petroleum Products by Fractionators during October, 2020 was 362.89 TMT which is 6.81% lower than the target for the month and 11.45% lower when compared with October, 2019. Cumulative production by Fractionators during April-October, 2020 was 2450.09 TMT which is 9.64% and 11.90% lower than target for the period and production during corresponding period of last year respectively.
Table 4: Production of Petroleum Products (TMT)
|
Oil Company
|
Target
|
October (Month)
|
April-October (Cumulative)
|
|
2020-21 (Apr-Mar)
|
2020-21
|
2019-20
|
% over last year
|
2020-21
|
2019-20
|
% over last year
|
|
Target
|
Prod.*
|
Prod.
|
Target
|
Prod.*
|
Prod.
|
|
CPSE
|
139203.86
|
12030.97
|
10348.46
|
11886.45
|
87.06
|
79205.03
|
61986.54
|
78809.19
|
78.65
|
|
IOCL
|
68912.87
|
6255.07
|
5576.39
|
5815.09
|
95.90
|
39587.80
|
31265.23
|
38830.53
|
80.52
|
|
BPCL
|
28965.13
|
2583.27
|
2027.50
|
2651.43
|
76.47
|
17000.52
|
12277.93
|
16913.79
|
72.59
|
|
HPCL
|
16438.97
|
840.28
|
1127.25
|
1325.34
|
85.05
|
9302.60
|
8666.78
|
9187.12
|
94.34
|
|
CPCL
|
8278.87
|
862.88
|
701.65
|
635.35
|
110.44
|
4075.99
|
3756.69
|
5423.16
|
69.27
|
|
NRL
|
2660.91
|
226.00
|
258.82
|
238.76
|
108.40
|
1560.10
|
1518.65
|
1586.94
|
95.70
|
|
MRPL
|
13887.11
|
1258.21
|
650.01
|
1213.79
|
53.55
|
7643.93
|
4458.39
|
6820.12
|
65.37
|
|
ONGC
|
60.00
|
5.27
|
6.84
|
6.70
|
102.14
|
34.09
|
42.86
|
47.55
|
90.15
|
|
JVs
|
13590.40
|
1136.48
|
1513.02
|
1671.06
|
90.54
|
7850.68
|
8612.19
|
10662.68
|
80.77
|
|
BORL
|
6958.40
|
588.48
|
510.95
|
600.20
|
85.13
|
4068.68
|
2659.77
|
4063.39
|
65.46
|
|
HMEL
|
6632.00
|
548.00
|
1002.07
|
1070.86
|
93.58
|
3782.00
|
5952.42
|
6599.30
|
90.20
|
|
Private
|
102154.50
|
8766.05
|
6652.17
|
8766.05
|
75.89
|
58603.85
|
53116.24
|
58603.85
|
90.64
|
|
RIL
|
82374.12
|
7029.68
|
6181.87
|
7029.68
|
87.94
|
46916.11
|
44025.96
|
46916.11
|
93.84
|
|
NEL
|
19780.38
|
1736.37
|
470.31
|
1736.37
|
27.09
|
11687.74
|
9090.28
|
11687.74
|
77.78
|
|
Total Refinery
|
254948.76
|
21933.50
|
18513.65
|
22323.55
|
82.93
|
145659.56
|
123714.97
|
148075.72
|
83.55
|
|
Fractionators
|
4572.73
|
389.42
|
362.89
|
409.80
|
88.55
|
2711.48
|
2450.09
|
2781.03
|
88.10
|
|
TOTAL
|
259521.49
|
22322.91
|
18876.54
|
22733.35
|
83.03
|
148371.04
|
126165.06
|
150856.75
|
83.63
|
Note: 1. Target for the year 2020-21 is provisional, subject to finalization. *: Provisional
2. Totals may not tally due to rounding off.
Figure 4: Monthly Refinery Production of Petorleum Products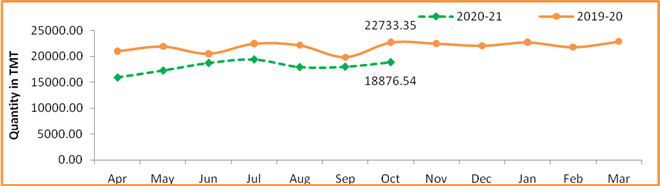
Click here to see Annexure-I
Click here to see Annexure-II
Click here to see Annexure-III
Click here to see Annexure-IV
Click here to see Annexure-V
*****
YB/SK