- Production of Crude Oil
Crude oil production[1] during November,2020 was2486.01 TMT which is7.25% lower than target and4.91% lower when compared with November, 2019.Cumulative crude oil production during April-November, 2020 was 20426.50 TMT which is 5.28% and 5.98% lower than target for the period and production during corresponding period of last yearrespectively. Unit-wise and State-wise crude oil production is given at Annexure-I. Unit-wise crude oil production for the month of November, 2020 and cumulatively for the period April-November, 2020 vis-à-vis same period of last year has been shown in Table-1 and month-wise in Figure-1.
Table-1: Crude Oil Production (in TMT)
|
Oil Company
|
Target
|
November (Month)
|
April-November (Cumulative)
|
|
2020-21 (Apr-Mar)
|
2020-21
|
2019-20
|
% over last year
|
2020-21
|
2019-20
|
% over last year
|
|
Target
|
Prod.*
|
Prod.
|
Target
|
Prod.*
|
Prod.
|
|
ONGC
|
20931.54
|
1739.06
|
1647.62
|
1673.23
|
98.47
|
14022.87
|
13508.55
|
13638.31
|
99.05
|
|
OIL
|
3268.00
|
273.97
|
243.20
|
260.17
|
93.47
|
2115.91
|
1985.34
|
2147.01
|
92.47
|
|
PSC Fields
|
8265.00
|
667.41
|
595.19
|
680.91
|
87.41
|
5426.93
|
4932.62
|
5939.42
|
83.05
|
|
Total
|
32464.53
|
2680.44
|
2486.01
|
2614.31
|
95.09
|
21565.71
|
20426.50
|
21724.74
|
94.02
|
Note: 1. Target for the year 2020-21 is provisional, subject to finalization. *: Provisional
2. Totals may not tally due to rounding off.
Figure-1: Monthly Crude Oil Production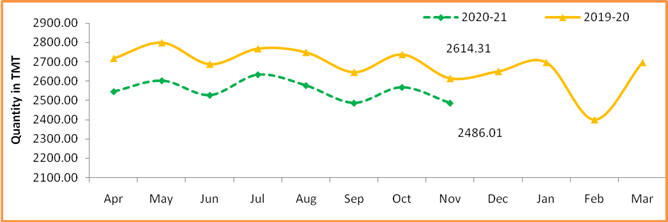
Unit-wise production details with reasons for shortfall are as under:
-
- Crude oil production by ONGC in nomination block during November, 2020 was 1647.62 TMT which is 5.26%lower than target and1.53%lower when compared with November 2019. Cumulative crude oil production by ONGC during April-November, 2020 was 13508.55 TMT which is 3.67%and 0.95% lower than target for the period andproduction during corresponding period of last year respectively. Reasons for shortfall in production are as under:
- Production planned from WO-16 cluster could not be realized due to delay in MOPU (Sagar Samrat) as activities at GPC yard Abu Dhabi got affected due to COVID restrictions/lockdown
- Production planned from new wells in Ratna field affected due to non- availability of ESPs (electrical submersible pumps) for well completion due to implications of COVID-19
- New wells planned under Cluster-8 development project delayed due to toppling of D-30-2 platform jacket during installation and further delay in installation of new platforms due to COVID implications
-
- Crude oil production by OIL in the nominationblock during November, 2020 was243.20 TMT which is 11.23% lower than the monthly target and 6.53% lower than the November, 2019. Cumulative crude oil production by OIL during April-November, 2020 was 1985.34 TMT which is 6.17% and 7.53% lower than target for the period and production during corresponding period of last year respectively. Reasons for shortfall in production are as under:
- Less than planned contribution from workover wells, drilling wells and old wells.
- Bandhs /blockade by local people and associations etc. after the Baghjan Blowout, protests/agitation etc.
-
- Crude oil production by Pvt/JVscompanies in the PSC (production sharing contract) regime during November, 2020 was 595.19 TMT which islower by 10.82% than the monthly target and 12.59%lowerthanNovember, 2019.Cumulative crude oil production by Pvt/JVs companies during April-November, 2020 was 4932.62 TMT which is 9.11% and 16.95% lower than target for the period and production during corresponding period of last year respectively.Reasons for shortfall in production are as under:
- RJ-ON-90/1 (CEIL): (1) Mangla–Shortfall in production due to reasons inter-alia failure of hydraulic submersible pump, delay in hook up of new injectors (Mangala), delayed start-up of polymer injection (Aishwarya), high water cut (Saraswati), ceasing of flow (Guda).
- CB-ONN-2003/1 (ONGC): Production is less due to COVID-19 situation, rig mobilization got delayed resulting in Drilling of new wells and less crude offtake.
- CB-ONN-2004/2 (ONGC): Development wells could not be drilled as planned in Q1 & Q2 FY2020-21 respectively.
- CB-ONN-2000/1 (GSPC):Lower production due to reservoir issues and shut in of wells.
- Production of Natural Gas
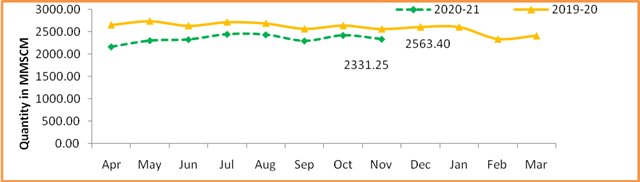
Natural gas production during November,2020 was 2331.25MMSCM which is 20.56% lower than the monthly target and 9.06% lower when compared with November, 2019. Cumulative natural gas production during April-November, 2020 was 18704.02MMSCM which is 14.79% and 11.81% lower than target for the period and production during corresponding period of last year respectively. Unit-wise and state-wise natural gas production is given at Annexure-II. Unit-wise natural gas production for the month of November, 2020 and cumulatively for the period April-November, 2020 vis-à-vis same period of last year has been shown in Table-2 and month-wise in Figure-2.
Table-2: Natural Gas Production (inMMSCM)
|
Oil Company
|
Target
|
November (Month)
|
April-November (Cumulative)
|
|
2020-21 (Apr-Mar)
|
2020-21
|
2019-20
|
% over last year
|
2020-21
|
2019-20
|
% over last year
|
|
Target
|
Prod.*
|
Prod.
|
Target
|
Prod.*
|
Prod.
|
|
ONGC
|
24437.08
|
2005.53
|
1823.53
|
1893.85
|
96.29
|
16299.03
|
14686.59
|
15919.91
|
92.25
|
|
OIL
|
3181.54
|
276.29
|
203.91
|
228.20
|
89.36
|
2126.41
|
1668.20
|
1851.81
|
90.08
|
|
PSC Fields
|
6826.82
|
652.73
|
303.81
|
441.36
|
68.84
|
3524.72
|
2349.23
|
3437.85
|
68.33
|
|
Total
|
34445.44
|
2934.54
|
2331.25
|
2563.40
|
90.94
|
21950.17
|
18704.02
|
21209.56
|
88.19
|
Note: 1. Target for the year 2020-21 is provisional, subject to finalization. *: Provisional
2. Totals may not tally due to rounding off.
Figure-2: Monthly Natural Gas Production
-
- Natural gas production by ONGC in the nominationblocks during November, 2020 was 1823.53MMSCM which is 9.07% lower than target and 3.71% lower when compared with November 2019. Cumulative natural gas production by ONGC duringApril-November, 2020 was 14686.59 MMSCM which is 9.89% and 7.75% lower than target for the period and production during corresponding period of last year respectively.Reasons for shortfall in production are as under:
- Closure of Gas wells in western offshore due to Hazira Plant shutdown on 24.09.20 and subsequent normalization.
- Less Gas production from WO16 cluster due to delay in Mobile Offshore Production Unit (MOPU) and non-realization of gain planned from new subsea wells in Bassein field due to delay in subsea umbilical connections/hook up jobs in view of Covid-19 implications.
- Less than planned production from Vasistha/S1 wells in EOA (Eastern Offshore Assets) due certain reservoir related issues.
-
- Natural gas production by OILin the nomination block during November, 2020 was 203.91 MMSCM which is 26.20% lower than monthly target and 10.64% lower than November, 2019. Cumulative natural gas production by OIL during April-November, 2020 was 1668.20 MMSCM which is 21.55% and 9.92% lower than target for the period and production during corresponding period of last year respectively. Reasons for shortfall in production are as under:
- Low upliftment/demand of gas by the major customers.
- Bandhs /blockade by local people and associations etc. after the Baghjan Blowout, protests/agitation etc.
-
- Natural gas production by Pvt/JVs companiesin the PSC (production sharing contracts) regime during November,2020 was 303.81MMSCM which is 53.46% lowerthan monthly target and31.16% lower than November, 2019. Cumulative natural gas production by Pvt/JVs during April-November, 2020 was 2349.23MMSCM which is 33.35% and 31.67% lower than target for the period and production during corresponding period of last year respectively. Reasons for shortfall in production are as under:
- KG-DWN-98/3 (RIL): Impact of COVID on project progress of R-Series D-34 field of KG-DWN-98/3 and efforts are being made for its start-up.
- RJ-ON/6 (FEL): Reduced gas offtake by Power Plant customer with Gas turbine in shut down.
- RJ-ON-90/1 (CEIL): RDG - Delay in new RDG plant start up due to Covid-19.
- KG-DWN-98/2 (ONGC): Well U3-B is producing less than the estimated profile and well is flowing with lower choke due to increase in water cut.
- Raniganj East (ESSAR): Production curtailed due delay in GAIL Pipeline & limited sales off-take and to avoid flaring.
- Crude Oil Processed (Crude Throughput)
Crude Oil Processed during November, 2020 was 20781.77TMT which is 1.57% higher than the target for the month but5.11% lower when compared with November, 2019. Cumulative crude throughput during April-November, 2020 was139337.10 TMT which is 15.94% and 17.82% lower than target for the period and crude throughput during corresponding period of last year respectively. Refinery-wise details of the crude throughput and capacity utilization during the month of November, 2020 vis-à-vis November, 2019 are given at Annexure-III and Annexure-IV. Company-wise crude throughput for the month of November, 2020 and cumulatively for the period April-November, 2020vis-à-vis same period of last year has been shown in Table-3 and month-wise in Figure-3.
Table 3: Crude Oil Processed (Crude Throughput) (in TMT)
|
Oil Company
|
Target
|
November (Month)
|
April-November (Cumulative)
|
|
2020-21 (Apr-Mar)
|
2020-21
|
2019-20
|
% over last year
|
2020-21
|
2019-20
|
% over last year
|
|
Target
|
Prod.*
|
Prod.
|
Target
|
Prod.*
|
Prod.
|
|
CPSE
|
148031.12
|
12223.69
|
12191.32
|
12572.54
|
96.97
|
96410.26
|
77587.58
|
96230.25
|
80.63
|
|
IOCL
|
72499.86
|
6049.23
|
6209.68
|
6090.08
|
101.96
|
47700.91
|
38771.00
|
46952.98
|
82.57
|
|
BPCL
|
30499.95
|
2629.42
|
2584.71
|
2700.98
|
95.70
|
20518.21
|
15365.83
|
20585.96
|
74.64
|
|
HPCL
|
17867.47
|
1067.63
|
1419.24
|
1520.37
|
93.35
|
11175.45
|
10741.22
|
11393.18
|
94.28
|
|
CPCL
|
9000.00
|
900.00
|
729.45
|
788.63
|
92.50
|
5370.00
|
4838.02
|
6688.48
|
72.33
|
|
NRL
|
2700.00
|
222.00
|
230.12
|
118.71
|
193.85
|
1804.00
|
1730.72
|
1759.48
|
98.37
|
|
MRPL
|
15400.00
|
1350.00
|
1011.44
|
1346.26
|
75.13
|
9800.00
|
6089.40
|
8791.63
|
69.26
|
|
ONGC
|
63.83
|
5.42
|
6.69
|
7.53
|
88.82
|
41.69
|
51.39
|
58.55
|
87.78
|
|
JVs
|
14772.00
|
640.00
|
1631.92
|
1730.29
|
94.31
|
9175.00
|
10871.81
|
13141.41
|
82.73
|
|
BORL
|
7800.00
|
640.00
|
593.93
|
657.83
|
90.29
|
5200.00
|
3666.24
|
5103.57
|
71.84
|
|
HMEL
|
6972.00
|
0.00
|
1038.00
|
1072.46
|
96.79
|
3975.00
|
7205.57
|
8037.85
|
89.65
|
|
Private
|
89515.16
|
7597.78
|
6958.53
|
7597.78
|
91.59
|
60183.37
|
50877.70
|
60183.37
|
84.54
|
|
RIL
|
68894.99
|
5939.81
|
5482.03
|
5939.81
|
92.29
|
46340.49
|
39922.60
|
46340.49
|
86.15
|
|
NEL
|
20620.18
|
1657.97
|
1476.50
|
1657.97
|
89.05
|
13842.89
|
10955.10
|
13842.89
|
79.14
|
|
TOTAL
|
252318.28
|
20461.47
|
20781.77
|
21900.62
|
94.89
|
165768.63
|
139337.10
|
169555.04
|
82.18
|
Note: 1. Target for the year 2020-21 is provisional, subject to finalization. *: Provisional
2. Totals may not tally due to rounding off.
Figure 3: Crude Oil Processed (Crude Throughput) 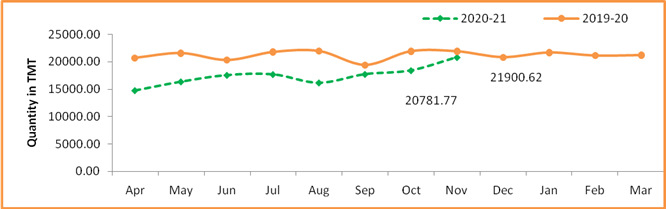
3.1 CPSE Refineries’ crude oil processed during November, 2020 was 12191.32TMT which is marginally lower by 0.26% than the target for the month and3.03%lowerwhen compared with November, 2019.Cumulative crude throughputby CPSE refineries during April-November, 2020 was 77587.58TMT which is 19.52% and 19.37% lower than target for the period and crude throughputduring corresponding period of last year respectively.Reasons for shortfall in production are as under:
- IOCL-Koyali& Mathura: Crude processed regulated for low product demand due to COVID impact.
- IOCLK-Digboi: Crude processed lower due to planned shutdown deferred.
- BPCL-Kochi: Crude processed lower due to emergency shutdown of VGO Hydro-treater Unit.
- HPCL-Mumbai: Crude processed lower due to unplanned shutdown of secondary units.
- CPCL-Manali & MRPL-Mangalore: Crude processed lower due to Lower demand due to impact of COVID-19 lockdown.
- NRL-Numaligarh: Crude processed lower due to in line with domestic allocation.
3.2 JV refineries’ crude oil processed during November, 2020 was 1631.92TMT which is 154.99% higher than the target for the month but 5.69% lower when compared with November, 2019. Cumulative crude throughput during April-November, 2020 was10871.81 TMT which is 18.49% higher than target for the period but17.27% lower when compare with the corresponding period of last year respectively.
3.3 Private refineries’ crude oil processed during November, 2020 was 6958.53TMT which is 8.41% lower than the corresponding month of last year. Cumulative crude throughputduring April-November, 2020 was 50877.70 TMT which is 15.46% lower than thecorresponding period of last year.
- Production of Petroleum Products
Production of Petroleum Products during November, 2020 was 21425.49 TMT which is 1.79% higher than the target for the month but 4.83% lower when compared with November, 2019. Cumulative production during April-November, 2020 was 147590.55 TMT which is 12.89% and 14.87% lower than target for the period and production during corresponding period of last year respectively. Unit-wise production of petroleum products is given at Annexure-V. Company-wise production for the month of November, 2020 and cumulatively for the period April-November, 2020 vis-à-Vis same period of last year has been shown in Table-4 and month-wise in Figure-4.
-
- Production of petroleum Products by Oil’s Refineries during November, 2020 was 21047.82 TMT which is 1.93% higher than the target for the month but 4.82% lower when compared with November, 2019. Cumulative production of petroleum products by refineries during April-November, 2020 was 144762.79 TMT which is 12.96% and 14.94% lower than target for the period and production during corresponding period of last year respectively.
-
- Production of petroleum Products by Fractionators during November, 2020 was 377.68 TMT which is 5.67% lower than the target for the month and 5.73% lower when compared with November, 2019. Cumulative production by Fractionators during April-November, 2020 was 2827.76 TMT which is 9.13% and 11.12% lower than target for the period and production during corresponding period of last year respectively.
Table 4: Production of Petroleum Products (TMT)
|
Oil Company
|
Target
|
November (Month)
|
April-November (Cumulative)
|
|
2020-21 (Apr-Mar)
|
2020-21
|
2019-20
|
% over last year
|
2020-21
|
2019-20
|
% over last year
|
|
Target
|
Prod.*
|
Prod.
|
Target
|
Prod.*
|
Prod.
|
|
CPSE
|
139203.86
|
11496.63
|
11512.94
|
11860.20
|
97.07
|
90701.66
|
73499.48
|
90669.39
|
81.06
|
|
IOCL
|
68912.87
|
5747.30
|
5899.48
|
5810.17
|
101.54
|
45335.10
|
37164.70
|
44640.70
|
83.25
|
|
BPCL
|
28965.13
|
2501.41
|
2474.28
|
2603.91
|
95.02
|
19501.93
|
14752.21
|
19517.69
|
75.58
|
|
HPCL
|
16438.97
|
976.36
|
1336.30
|
1369.33
|
97.59
|
10278.97
|
10003.08
|
10556.45
|
94.76
|
|
CPCL
|
8278.87
|
835.00
|
690.61
|
705.09
|
97.95
|
4910.99
|
4447.30
|
6128.25
|
72.57
|
|
NRL
|
2660.91
|
218.71
|
239.74
|
111.13
|
215.74
|
1778.80
|
1758.40
|
1698.07
|
103.55
|
|
MRPL
|
13887.11
|
1212.76
|
866.12
|
1253.50
|
69.10
|
8856.69
|
5324.51
|
8073.61
|
65.95
|
|
ONGC
|
60.00
|
5.10
|
6.42
|
7.08
|
90.65
|
39.19
|
49.28
|
54.63
|
90.21
|
|
JVs
|
13590.40
|
570.92
|
1495.05
|
1670.89
|
89.48
|
8421.60
|
10107.24
|
12333.57
|
81.95
|
|
BORL
|
6958.40
|
570.92
|
531.43
|
608.03
|
87.40
|
4639.60
|
3191.20
|
4671.42
|
68.31
|
|
HMEL
|
6632.00
|
0.00
|
963.62
|
1062.86
|
90.66
|
3782.00
|
6916.05
|
7662.15
|
90.26
|
|
Private
|
102154.50
|
8581.66
|
8039.83
|
8581.66
|
93.69
|
67185.50
|
61156.07
|
67185.50
|
91.03
|
|
RIL
|
82374.12
|
7042.15
|
6536.54
|
7042.15
|
92.82
|
53958.26
|
50562.50
|
53958.26
|
93.71
|
|
NEL
|
19780.38
|
1539.50
|
1503.28
|
1539.50
|
97.65
|
13227.24
|
10593.57
|
13227.24
|
80.09
|
|
Total Refinery
|
254948.76
|
20649.21
|
21047.82
|
22112.74
|
95.18
|
166308.77
|
144762.79
|
170188.47
|
85.06
|
|
Fractionators
|
4572.73
|
400.36
|
377.68
|
400.62
|
94.27
|
3111.84
|
2827.76
|
3181.64
|
88.88
|
|
TOTAL
|
259521.49
|
21049.57
|
21425.49
|
22513.36
|
95.17
|
169420.61
|
147590.55
|
173370.11
|
85.13
|
Note: 1. Target for the year 2020-21 is provisional, subject to finalization. *: Provisional
2. Totals may not tally due to rounding off.
Figure 4: Monthly Refinery Production of Petroleum Products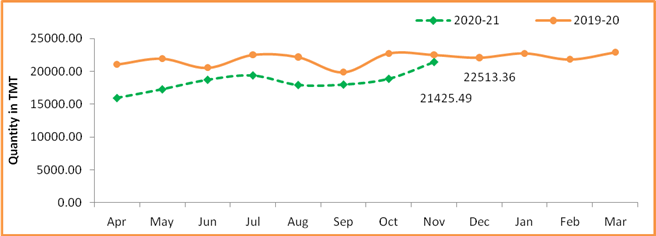
[1]Including condensate
Click here to see Annexure-I
Click here to see Annexure-II
Click here to see Annexure-III
Click here to see Annexure-IV
Click here to see Annexure-V
******
YB/SK