- Production of Crude Oil
Crude oil production during December,2020 was2555.66 TMT which is6.85% lower than target and3.59% lower when compared with December, 2019.Cumulative crude oil production during April-December, 2020 was 22982.16 TMT which is 5.27% and 5.72% lower than target for the period and production during corresponding period of last yearrespectively. Unit-wise and State-wise crude oil production is given at Annexure-I. Unit-wise crude oil production for the month of December, 2020 and cumulatively for the period April-December, 2020 vis-à-vis same period of last year has been shown in Table-1 and month-wise in Figure-1.
Table-1: Crude Oil Production (in TMT)
|
Oil Company
|
Target
|
December (Month)
|
April-December (Cumulative)
|
|
2020-21 (Apr-Mar)
|
2020
|
2019
|
% over last year
|
2020
|
2019
|
% over last year
|
|
Target
|
Prod.*
|
Prod.
|
Target
|
Prod.*
|
Prod.
|
|
|
ONGC
|
20931.68
|
1785.15
|
1700.54
|
1748.65
|
97.25
|
15807.95
|
15209.09
|
15386.96
|
98.84
|
|
OIL
|
3121.00
|
267.73
|
241.35
|
207.74
|
116.18
|
2334.19
|
2226.69
|
2354.74
|
94.56
|
|
PSC Fields
|
8265.00
|
690.72
|
613.76
|
694.44
|
88.38
|
6117.65
|
5546.38
|
6633.86
|
83.61
|
|
Total
|
32317.68
|
2743.60
|
2555.66
|
2650.83
|
96.41
|
24259.79
|
22982.16
|
24375.57
|
94.28
|
Note: Totals may not tally due to rounding off. *: Provisional
Figure-1: Monthly Crude Oil Production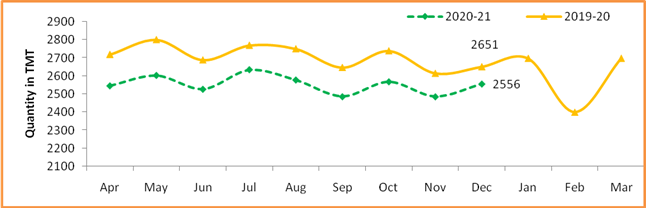
Unit-wise production details with reasons for shortfall are as under:
-
- Crude oil production by ONGC(Oil and Natural Gas Corporation) in nomination blocksduring December, 2020 was 1700.54TMT which is 4.74%lower than target and 2.75%lower when compared with December 2019. Cumulative crude oil production by ONGC during April-December, 2020 was 15209.09 TMT which is 3.79%and 1.16% lower than target for the period andproduction during corresponding period of last year respectively. Reasons for shortfall in production are as under:
- Production planned from WO-16 cluster could not be realized due to delay in Mobile Offshore Production Unit (MOPU) (Sagar Samrat) as activities at Gulf piping company (GPC) yard Abu Dhabi got affected due to COVID-19 restrictions/lockdown
- Production planned from new wells in Ratna field affected due to non- availability of electric submersible pumps (ESPs) for well completion due to implications of COVID-19.
- New wells planned under Cluster-8 development project delayed due to delay in installation of new platforms due to COVID-19 implications.
-
- Crude oil production by OIL(Oil India Ltd) in the nominationblock during December, 2020 was241.35 TMT which is 16.18% % higher than the production during December, 2019 but9.85% lower than the monthly target. Cumulative crude oil production by OIL during April-December, 2020 was 2226.69 TMT which is 4.61% and 5.44% lower than target for the period and production during corresponding period of last year respectively. Reasons for shortfall in production are as under:
- Less than planned contribution from workover wells, drilling wells and old wells.
- Bandhs /blockade by local people and associations etc. after the Baghjan Blowout, protests/agitation etc.
-
- Crude oil production by Pvt/JVscompanies in the PSC (Production Sharing Contract) regime during December, 2020 was 613.76 TMT which islower by 11.14% than the monthly target and 11.62%lowerthanDecember, 2019.Cumulative crude oil production by Pvt/JVs companies during April-December, 2020 was 5546.38 TMT which is 9.34% and 16.39% lower than target for the period and production during corresponding period of last year respectively.Reasons for shortfall in production are as under:
- RJ-ON-90/1 (Cairn Energy India Ltd): Delay in Mangla upgradation project, delayed startup of polymer injection (Bhagyam & Aishwarya), delay in hook-up of stage-2 wells in ABH field, ceasing of flow in wells at Satellite fields. Also, well and surface facilities Projects impacted by COVID-19 at Tukaram, Kaam-1 and GSV Fields.
- B-80 (Hindustan Oil Exploration Company Ltd): Production not commenced due to delay in completion of field development activities due to COVID-19.
- RAVVA (Cairn Energy India Ltd): Decline in production from producer wells.
- CB-ONN-2004/2 (Oil & Natural Gas Corporation): Production is less due to COVID-19 situation, rig mobilization got delayed resulting in drilling of new wells and less crude offtake.
- CB-ONN-2004/2 (Oil & Natural Gas Corporation): Development wells could not be drilled as planned.
- CB-ONN-2003/1 (Sun Petrochemical Pvt. Ltd): Lower production due to delay in drilling of new wells due to COVID-19 situation and less crude offtake.
- Production of Natural Gas
Natural gas production during December,2020 was 2424.90MMSCM which is 22.94% lower than the monthly target and 7.11% lower when compared with December, 2019. Cumulative natural gas production during April-December, 2020 was 21128.92MMSCM which is 13.38% and 11.30% lower than target for the period and production during corresponding period of last year respectively. Unit-wise and state-wise natural gas production is given at Annexure-II. Unit-wise natural gas production for the month of December, 2020 and cumulatively for the period April-December, 2020 vis-à-vis same period of last year has been shown in Table-2 and month-wise in Figure-2.
Table-2: Natural Gas Production (inMMSCM)
|
Oil Company
|
Target
|
December (Month)
|
April-December (Cumulative)
|
|
2020-21 (Apr-Mar)
|
2020
|
2019
|
% over last year
|
2020
|
2019
|
% over last year
|
|
Target
|
Prod.*
|
Prod.
|
Target
|
Prod.*
|
Prod.
|
|
ONGC
|
23982.98
|
2053.29
|
1857.73
|
1998.37
|
92.96
|
18030.02
|
16544.32
|
17918.28
|
92.33
|
|
OIL
|
2761.73
|
261.47
|
201.63
|
195.57
|
103.10
|
2006.85
|
1869.83
|
2047.37
|
91.33
|
|
PSC Fields
|
6826.82
|
832.18
|
365.55
|
416.44
|
87.78
|
4356.90
|
2714.77
|
3854.29
|
70.44
|
|
Total
|
33571.53
|
3146.94
|
2424.90
|
2610.38
|
92.89
|
24393.77
|
21128.92
|
23819.94
|
88.70
|
Note: Totals may not tally due to rounding off. *: Provisional
Figure-2: Monthly Natural Gas Production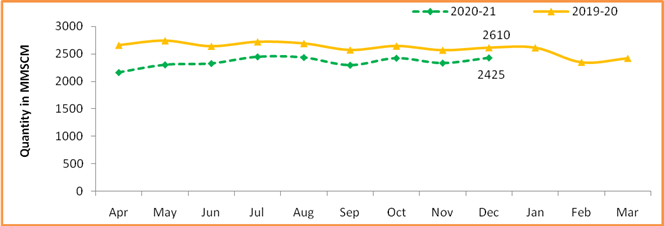
-
- Natural gas production by ONGC in the nominationblocks during December, 2020 was 1857.73MMSCM which is 9.52% lower than target and 7.04% lower when compared with December 2019. Cumulative natural gas production by ONGC duringApril-December, 2020 was 16544.32 MMSCM which is 8.24% and 7.67% lower than target for the period and production during corresponding period of last year respectively.Reasons for shortfall in production are as under:
- Less gas production from WO16 cluster due to delay in MOPU.
- Less gas dispatch from offshore post Hazira Plant shutdown.
- Less than planned production from Vasistha/S1 wells in Eastern Offshore Assets (EOA) due to certain reservoir related issues.
- Less gas production due to less off-take by consumers in Cauvery Asset.
-
- Natural gas production by OILin the nomination block during December, 2020 was 201.63 MMSCM which is 22.89% lower than monthly target and 3.10% higher than December, 2019. Cumulative natural gas production by OIL during April-December, 2020 was 1869.83 MMSCM which is 6.83% and 8.67% lower than target for the period and production during corresponding period of last year respectively. Reasons for shortfall in production are as under:
- Low upliftment/demand of gas by the major customers.
- Bandhs /blockade by local people and associations etc. after the Baghjan Blowout, protests/agitation etc.
-
- Natural gas production by Pvt/JVs companiesin the PSC (production sharing contracts) regime during December,2020 was 365.55MMSCM which is 56.07% lowerthan monthly target and 12.22% lower than December, 2019. Cumulative natural gas production by Pvt/JVs during April-December, 2020 was 2714.77 MMSCM which is 37.69% and 29.56% lower than target for the period and production during corresponding period of last year respectively. Reasons for shortfall in production are as under:
- KG-DWN-98/3 (Reliance Industries Ltd): Delay in R-Cluster (D34) projectdue to COVID-19.
- RJ-ON/6 (Focus Energy Limited): Reduced gas offtake by the Customer.
- RJ-ON-90/1 (Cairn Energy India Ltd): Delay in new Rageshwari Deep Gas plant start up due to Covid-19.
- KG-DWN-98/2 (Oil & Natural Gas Corporation.): Lower production due to increase in water cut of well.
- Raniganj East (Essar Oil and Gas Exploration & Production Ltd): Production curtailed due to limited sales off-take and to avoid flaring.
- Crude Oil Processed (Crude Throughput)
Crude Oil Processed during December, 2020 was 21024.40 TMT which is 4.02% lower than the target for the month but 0.93% higher when compared with December, 2019. Cumulative crude throughput during April-December, 2020 was160361.50 TMT which is 14.46% and 15.77% lower than target for the period and crude throughput during corresponding period of last year respectively. Refinery-wise details of the crude throughput and capacity utilization during the month of December, 2020 vis-à-vis December, 2019 are given at Annexure-III and Annexure-IV. Company-wise crude throughput for the month of December, 2020 and cumulatively for the period April-December, 2020vis-à-vis same period of last year has been shown in Table-3 and month-wise in Figure-3.
Table 3: Crude Oil Processed (Crude Throughput) (in TMT)
|
Oil Company
|
Target
|
December (Month)
|
April-December (Cumulative)
|
|
2020-21 (Apr-Mar)
|
2020
|
2019
|
% over last year
|
2020
|
2019
|
% over last year
|
|
Target
|
Prod.*
|
Prod.
|
Target
|
Prod.*
|
Prod.
|
|
CPSE
|
147377.43
|
13137.98
|
12141.04
|
11662.07
|
104.11
|
109338.26
|
89728.63
|
107892.33
|
83.16
|
|
IOCL
|
72400.04
|
6368.54
|
5987.56
|
5363.46
|
111.64
|
54069.45
|
44758.57
|
52316.44
|
85.55
|
|
BPCL
|
33000.00
|
2750.00
|
2529.29
|
2753.80
|
91.85
|
24750.00
|
17895.11
|
23339.76
|
76.67
|
|
HPCL
|
16999.28
|
1570.56
|
1284.48
|
1246.17
|
103.07
|
13070.92
|
12025.70
|
12639.36
|
95.14
|
|
CPCL
|
10290.00
|
920.00
|
766.27
|
936.78
|
81.80
|
7610.00
|
5604.29
|
7625.26
|
73.50
|
|
NRL
|
2549.86
|
218.27
|
259.78
|
0.00
|
0
|
1916.16
|
1990.50
|
1759.48
|
113.13
|
|
MRPL
|
12074.42
|
1305.00
|
1306.56
|
1354.75
|
96.44
|
7874.42
|
7395.96
|
10146.38
|
72.89
|
|
ONGC
|
63.83
|
5.61
|
7.11
|
7.10
|
100.07
|
47.30
|
58.50
|
65.65
|
89.11
|
|
JVs
|
14772.00
|
1428.00
|
1652.06
|
1827.67
|
90.39
|
10603.00
|
12523.87
|
14969.09
|
83.66
|
|
BORL
|
7800.00
|
660.00
|
625.34
|
717.45
|
87.16
|
5860.00
|
4291.59
|
5821.02
|
73.73
|
|
HMEL
|
6972.00
|
768.00
|
1026.72
|
1110.23
|
92.48
|
4743.00
|
8232.29
|
9148.07
|
89.99
|
|
Private
|
89515.16
|
7340.11
|
7231.30
|
7340.11
|
98.52
|
67523.48
|
58109.00
|
67523.48
|
86.06
|
|
RIL
|
68894.99
|
5635.15
|
5687.66
|
5635.15
|
100.93
|
51975.64
|
45610.26
|
51975.63
|
87.75
|
|
NEL
|
20620.18
|
1704.96
|
1543.64
|
1704.96
|
90.54
|
15547.85
|
12498.74
|
15547.85
|
80.39
|
|
TOTAL
|
251664.61
|
21906.09
|
21024.40
|
20829.85
|
100.93
|
187464.74
|
160361.50
|
190384.89
|
84.23
|
Note: Totals may not tally due to rounding off. *: Provisional
Figure 3: Crude Oil Processed (Crude Throughput) 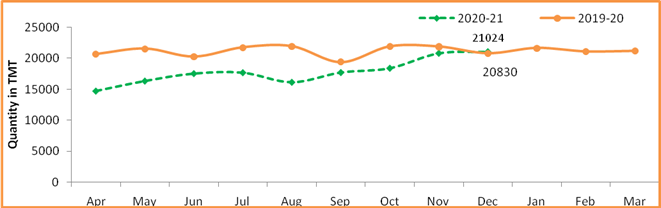
3.1 CPSE Refineries’ crude oil processed during December, 2020 was 12141.04TMT which is 4.11% higher when compared with December, 2019 but 7.59% lower than the target for the month.Cumulative crude throughputby CPSE refineries during April-December, 2020 was 89728.63 TMT which is 17.93% and 16.84% lower than target for the period and crude throughputduring corresponding period of last year respectively.Reasons for shortfall in production are as under:
- IOCL-Barauni, Koyali & Panipat: Crude processed regulated for low product demand due to COVID-19 impact.
- IOCL-Haldia: Crude processed lower due to gas turbine-3 (GT-3)/steam turbine gas (STG-2) interruption.
- IOCL-Digboi: Crude processed lower due to planned shutdown deferred.
- IOCL-Bongaigaon: Inline with crude availability /imported crude pipeline shutdown.
- IOCL-Paradip: Crude processed lower due to Indmax unit shutdown.
- BPCL-Kochi: Crude processed lower due to shutdown of Diesel Hydrotreating (DHDT) unit.
- HPCL-Mumbai: Crude processed lower due to planned shutdown of Fluid catalytic cracking unit (FCC).
- HPCL-Visakh: Crude processed lower due to unplanned shutdown of primary units.
- CPCL-Manali &MRPL-Mangalore: Crude processed lower due to low demand due to impact of COVID-19 lockdown.
3.2 JV refineries’ crude oil processed during December, 2020 was 1652.06 TMT which is 15.69% higher than the target for the month but 9.61% lower when compared with December, 2019. Cumulative crude throughput during April-December, 2020 was12523.87TMT which is 18.12% higher than target for the period but 16.34% lower when compare with the corresponding period of last year respectively.
3.3 Private refineries’ crude oil processed during December, 2020 was 7231.30 TMT which is 1.48% lower than the corresponding month of last year. Cumulative crude throughputduring April-December, 2020 was 58109.0 TMT which is 13.94% lower than thecorresponding period of last year.
- Production of Petroleum Products
Production of Petroleum Products during December, 2020 was 21480.30 TMT which is 6.80% lower than the target for the month and 2.78% lower when compared with December, 2019. Cumulative production during April-December, 2020 was 169070.85 TMT which is 12.10% and 13.50% lower than target for the period and production during corresponding period of last year respectively. Unit-wise production of petroleum products is given at Annexure-V. Company-wise production for the month of December, 2020 and cumulatively for the period April-December, 2020 vis-à-Vis same period of last year has been shown in Table-4 and month-wise in Figure-4.
Figure 4: Monthly Refinery Production of Petroleum Products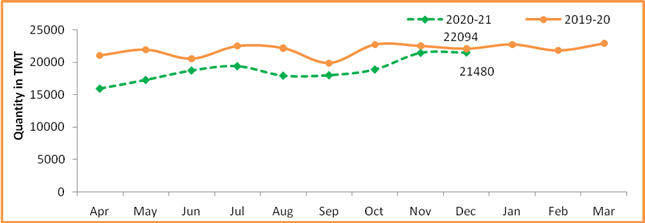
Table 4: Production of Petroleum Products (TMT)
|
Oil Company
|
Target
|
December (Month)
|
April-December (Cumulative)
|
|
2020-21 (Apr-Mar)
|
2020
|
2019
|
% over last year
|
2020
|
2019
|
% over last year
|
|
Target
|
Prod.*
|
Prod.
|
Target
|
Prod.*
|
Prod.
|
|
CPSE
|
138753.95
|
12406.92
|
11445.19
|
11117.10
|
102.95
|
103010.83
|
84944.67
|
101786.49
|
83.45
|
|
IOCL
|
68760.50
|
6025.96
|
5756.96
|
5143.08
|
111.94
|
51327.50
|
42921.67
|
49783.77
|
86.22
|
|
BPCL
|
31319.00
|
2632.00
|
2399.72
|
2716.22
|
88.35
|
23505.00
|
17151.93
|
22233.91
|
77.14
|
|
HPCL
|
15914.53
|
1467.26
|
1157.16
|
1227.28
|
94.29
|
12240.04
|
11160.24
|
11783.72
|
94.71
|
|
CPCL
|
9527.02
|
855.28
|
683.29
|
855.19
|
79.90
|
7034.82
|
5130.58
|
6983.44
|
73.47
|
|
NRL
|
2554.46
|
220.10
|
256.32
|
4.14
|
-
|
1912.54
|
2014.72
|
1702.20
|
118.36
|
|
MRPL
|
10618.44
|
1201.06
|
1184.93
|
1164.31
|
101.77
|
6946.47
|
6509.45
|
9237.92
|
70.46
|
|
ONGC
|
60.00
|
5.27
|
6.80
|
6.90
|
98.61
|
44.46
|
56.08
|
61.53
|
91.15
|
|
JVs
|
13590.40
|
1318.48
|
1515.95
|
1656.54
|
91.51
|
9740.08
|
11623.20
|
13990.11
|
83.08
|
|
BORL
|
6958.40
|
588.48
|
578.73
|
642.14
|
90.13
|
5228.08
|
3769.93
|
5313.56
|
70.95
|
|
HMEL
|
6632.00
|
730.00
|
937.22
|
1014.40
|
92.39
|
4512.00
|
7853.27
|
8676.56
|
90.51
|
|
Private
|
102154.50
|
8910.70
|
8146.49
|
8910.70
|
91.42
|
76096.20
|
69302.56
|
76096.20
|
91.07
|
|
RIL
|
82374.12
|
7277.40
|
6610.23
|
7277.40
|
90.83
|
61235.66
|
57172.73
|
61235.66
|
93.37
|
|
NEL
|
19780.38
|
1633.30
|
1536.26
|
1633.30
|
94.06
|
14860.54
|
12129.83
|
14860.54
|
81.62
|
|
Total Refinery
|
254498.86
|
22636.10
|
21107.63
|
21684.34
|
97.34
|
188847.11
|
165870.42
|
191872.80
|
86.45
|
|
Fractionators
|
4523.28
|
411.41
|
372.66
|
409.91
|
90.91
|
3487.60
|
3200.43
|
3591.56
|
89.11
|
|
TOTAL
|
259022.13
|
23047.51
|
21480.30
|
22094.25
|
97.22
|
192334.71
|
169070.85
|
195464.36
|
86.50
|
Note: Totals may not tally due to rounding off. *: Provisional
-
- Production of petroleum Products by Oil’s Refineries during December, 2020 was 21107.63 TMT which is 6.75% lower than the target for the month and 2.66% lower when compared with December, 2019. Cumulative production of petroleum products by refineries during April-December, 2020 was 165870.42 TMT which is 12.17% and 13.55% lower than target for the period and production during corresponding period of last year respectively.
-
- Production of petroleum Products by Fractionators during December, 2020 was 372.66 TMT which is 9.42% lower than the target for the month and 9.09% lower when compared with December, 2019. Cumulative production by Fractionators during April-December, 2020 was 3200.43 TMT which is 8.23% and 10.89% lower than target for the period and production during corresponding period of last year respectively.
Click here to see all Annexures
***********
YB/SK