Embarking upon a long journey for blue skies in the NCR, the Commission for Air Quality Management in NCR and Adjoining Areas (CAQM), since its inception in 2021, through a series of firm steps, has initiated various policy measures and field actions for the cause.
Concerted and persistent efforts of all the stakeholders round the year have helped to improve the general air quality in Delhi. Significant improvement in the air quality of Delhi was witnessed during 2022 as compared to the past years (barring the periods of very low anthropogenic, industrial and commercial activities during the Covid affected year 2020, owing to complete lockdowns and other restrictions), pursuant to various preventive and mitigative field actions through numerous statutory directions and orders of the Commission, covering all major sectors contributing to the overall air quality. While restrictions were also on for a considerable duration during 2021, the air quality indices viz. PM10 and PM2.5 concentrations in 2022 were even better than 2021.
Comparative tabulations for various air quality related parameters for 2018, 2019, 2020, 2021 and 2022 respectively follow as under:
Month-wise Daily Avg. AQI for Delhi
|
Month
|
2018
|
2019
|
2020
|
2021
|
2022
|
|
January
|
328
|
328
|
286
|
324
|
279
|
|
February
|
243
|
242
|
241
|
288
|
225
|
|
March
|
203
|
184
|
128
|
223
|
217
|
|
April
|
222
|
211
|
110
|
202
|
255
|
|
May
|
217
|
221
|
144
|
146
|
212
|
|
June
|
202
|
189
|
123
|
147
|
190
|
|
July
|
104
|
134
|
84
|
110
|
87
|
|
August
|
111
|
86
|
64
|
107
|
93
|
|
September
|
112
|
98
|
116
|
78
|
104
|
|
October
|
269
|
234
|
266
|
173
|
210
|
|
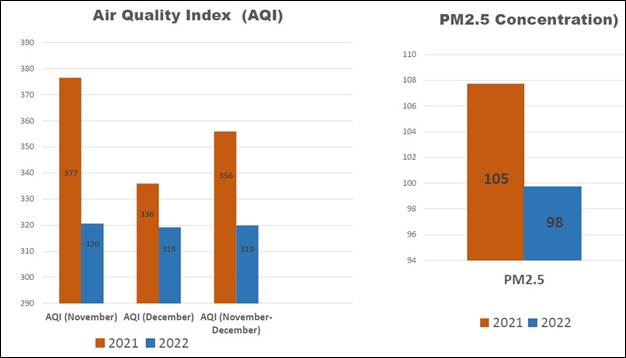
November
|
335
|
312
|
328
|
377
|
320
|
|
December
|
360
|
337
|
332
|
336
|
319
|
The year 2022 witnessed 3 months (January, February and December) of
best ever daily average AQI and 3 months (July, October and November) with
second best daily average AQI during the entire period from 2018 to 2022, even taking into account the Covid affected low activity years of 2020 and 2021. Exceptionally prolonged dry spells during April, May and June in 2022, coupled with transportation of fine dust and particulate matter not only from the adjoining areas but also transboundary, resulted in poor AQI for these months, which otherwise was comparatively better for all other months during 2022 vis-à-vis previous years.
Daily Avg. AQI for Delhi during the entire year
|
Year
|
2018
|
2019
|
2020
|
2021
|
2022
|
|
Daily Avg. AQI
|
225
|
215
|
185
|
209
|
209
|
The average daily AQI for Delhi during the entire year 2022 has been the best so far since 2015, barring 2020 which saw an exceptional AQI owing to continued spells of lockdown and low anthropogenic activities round the year. While restrictions were also on for a considerable duration during 2021 leading to low levels of industrial, vehicular and other anthropogenic activities, the daily average AQI in 2022, with no such restrictions and all anthropogenic activities returning to normal; rather in a much higher proportion, was maintained at the levels of 2021. However, PM10 and PM2.5 concentrations and other related Air quality parameters in 2022 were even better than 2021 in some aspects.
Comparative PM10 and PM2.5 Concentrations
As per IMD data, in terms of daily average Particulate Matter emissions (PM2.5 and PM10), the comparative concentration values in Delhi read as under:
|
Year
|
Daily avg. PM10 (µgm/m3)
|
Daily avg. PM2.5 (µgm/m3)
|
|
2018
|
243
|
115
|
|
2019
|
218
|
108
|
|
2020*
|
181
|
95
|
|
2021
|
213
|
105
|
|
2022
|
211
|
98
|
* Covid Year
The Year 2022 has thus witnessed the lowest ever recorded daily average values for PM10 and PM2.5 respectively, barring the Covid affected 2020 with lowest anthropogenic activities. Despite restrictions continuing also in 2021, the PM10 and PM2.5 concentrations in 2022 (with all activities in full throttle in the region) were even lower than those recorded in 2021.
Comparative AQI Category status for Delhi
|
AQI Category
|
No. of Days
|
|
2018
|
2019
|
2020
|
2021
|
2022
|
2018
|
2019
|
2020
|
2021
|
2022
|
|
Good
|
(0-50)
|
0
|
2
|
5
|
1
|
3
|
53
|
61
|
100
|
73
|
68
|
|
Satisfactory
|
(51-100)
|
53
|
59
|
95
|
72
|
65
|
|
Moderate
|
(101-200)
|
106
|
121
|
127
|
124
|
95
|
220
|
224
|
202
|
204
|
225
|
|
Poor
|
(201-300)
|
114
|
103
|
75
|
80
|
130
|
|
Very Poor
|
(301-400)
|
72
|
56
|
49
|
64
|
66
|
92
|
80
|
64
|
88
|
72
|
|
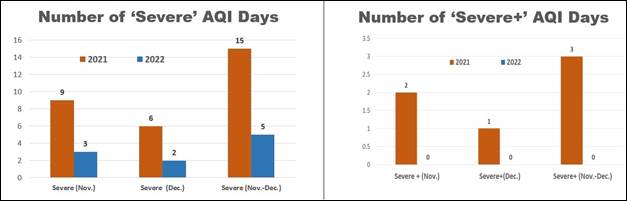
Severe
|
401-450)
|
20
|
19
|
13
|
20
|
6
|
|
Severe +
|
>450
|
0
|
5
|
2
|
4
|
0
|
As per the CPCB criteria for the air quality category based on gradation of the daily average AQI, the year 2022 witnessed most days with “Good” and “Satisfactory” air quality (barring Covid affected 2020 and 2021).
Likewise, a remarkable reduction in the number of days with “Severe” air quality (AQI 401 – 450) was witnessed during 2022 as compared to all previous years. Delhi was also saved of any “Severe+” day (AQI > 450) during 2022, which was not the case in 3 previous years, including 2020 and 2021.
Comparative hourly PM2.5 values for Delhi
|
Year
|
No. of hours for which PM2.5 was in “Severe” category
|
|
2021
|
628 hrs. (7.2% of total time of the year)
|
|
2022
|
204 hrs. (2.3% of total time of the year)
|
Comparative hourly AQI Category for Delhi
|
Year
|
No. of hours for which AQI was in “Good” category
(AQI < 200)
|
|
2021
|
827 hrs.
|
|
2022
|
1096 hrs.
|
Comparative Delhi AQI Around Diwali Festival
|
Year
|
Pre-Diwali Day
|
Diwali Day
|
Post-Diwali Day
|
|
2018
|
338
|
281*
|
390
|
|
2019
|
287
|
337
|
368
|
|
2020
|
339
|
414
|
435
|
|
2021
|
314
|
382
|
462
|
|
2022
|
259
|
312
|
303
|
* Better AQI attributed to rain around Diwali in 2018
The above AQI tabulation for 3 days around Diwali festival indicates that never before, the Delhi AQI around Diwali time was better than, as in 2022.
Comparative Daily Avg. Air Quality during Post-monsoon & Winter months
|
Month
|
2018
|
2019
|
2020
|
2021
|
2022
|
|
January
|
328
|
328
|
286
|
324
|
279
|
|
February
|
243
|
242
|
241
|
288
|
225
|
|
October
|
269
|
234
|
266
|
173
|
210
|
|
November
|
335
|
312
|
328
|
377
|
320
|
|
December
|
360
|
337
|
332
|
336
|
316
|
|
Daily Avg. AQI during these months
|
298
|
286
|
282
|
290
|
262
|
The Post -Monsoon and Winter periods, from October in a particular year up till February of the next year, witness episodic events like extensive farm burnings during paddy harvesting season, bursting of crackers during religious festivals and marriages/ other celebrations etc. Coupled with the above, adverse climatic, meteorological, low temperature and calm wind conditions that generally prevail during winters in the entire region impede effective dispersion of the pollutants from the region, resulting in to a spike in the daily average AQI in Delhi during the period. The year 2022 in particular, witnessed the best air quality during post-monsoon and winter months owing to continual efforts round the year and concerted drives to prevent and abate air polluting activities particularly during these months.
Invoking the Graded Response Action Plan (GRAP)
The GRAP has been classified under Four different stages of Air Quality Index (AQI) viz. Poor (201-300), Very Poor (301-400), Severe (401-450) and Severe+ (more than 450). Preventive and restrictive actions, including bans on certain set of activities also impacting the economy and livelihood options, are needed to be imposed in NCR in adverse air quality scenarios as laid down in the GRAP. Owing to a relatively better air quality during 2022, the No. of days for which GRAP Stage III and above were required to be invoked were much lesser as tabulated under:
|
Year
|
No. of days under GRAP Stage III (including partial restrictions)
|
No. of days under GRAP Stage IV
(including partial restrictions)
|
|
2018
|
-
|
61
|
|
2019
|
52
|
135
|
|
2020
|
61
|
-
|
|
2021
|
07
|
23
|
|
2022
|
20
|
03
|
With persistent field level efforts and targeted policy initiatives for quantified results in the short/ medium/ long term, it is expected that air quality scenario over Delhi will see further gradual but marked improvement, year on year.
*****
MJPS/SSV