|
Particulars
|
Wireless*
|
Wireline
|
Total
(Wireless+
Wireline)
|
|
Broadband Subscribers (Million)
|
1006.89
|
45.83
|
1052.72
|
|
Urban Telephone Subscribers (Million)
|
725.67
|
42.59
|
768.26
|
|
Net Addition in January 2026 (Million)
|
4.59
|
0.30
|
4.89
|
|
Monthly Growth Rate
|
0.64%
|
0.72%
|
0.64%
|
|
Rural Telephone Subscribers (Million)
|
540.67
|
5.07
|
545.74
|
|
Net Addition in January 2026 (Million)
|
2.98
|
-0.01
|
2.97
|
|
Monthly Growth Rate
|
0.55%
|
-0.24%
|
0.55%
|
|
Total Telephone Subscribers (Million)
|
1266.34
|
47.66
|
1314.00
|
|
Net Addition in January 2026 (Million)
|
7.57
|
0.29
|
7.86
|
|
Monthly Growth Rate
|
0.60%
|
0.61%
|
0.60%
|
|
Share of Urban Subscribers
|
57.30%
|
89.36%
|
58.47%
|
|
Share of Rural Subscribers
|
42.70%
|
10.64%
|
41.53%
|
|
Overall Tele-density@ with M2M cellular mobile connections
|
88.87%
|
3.34%
|
92.22%
|
|
Urban Tele-density@
|
141.53%
|
8.31%
|
149.84%
|
|
Rural Tele-density@
|
59.27%
|
0.56%
|
59.83%
|
|
Tele-density@ without M2M cellular mobile connections
|
80.91%
|
3.34%
|
84.26%
|
- In the month of January 2026, 15.98 million subscribers submitted their requests for Mobile Number Portability (MNP).
- The number of active wireless (mobile) subscribers (on the date of peak VLR#) in January 2026 was 1172.10 million.
____________________________________________________________________________________________________________________________________________________
Note:
* The wireless subscriber base comprises of wireless mobile telephone subscribers (including M2M cellular mobile connections), and FWA subscribers.
@ Tele-density has been computed on the basis of the projection of population from the ‘Report of the Technical Group on Population Projections for India and States 2011 – 2036’, published in July 2020.
# VLR is acronym of Visitor Location Register. The dates of peak VLR for various Telecom Service Providers (TSPs) may be different in different service areas.
- Information in this Press Release is based on the data provided by the Telecom Service Providers (TSPs) to TRAI.
Broadband Subscribers
- As per the information received from 1480 operators for the month of January 2026, the total number of broadband subscribers increased from 1050.60 million at the end of December 2025 to 1052.72 million at the end of January 2026 with a monthly growth rate of 0.20%. Segment-wise number of broadband subscribers and their monthly growth rates are as below: -
Segment–wise Broadband Subscribers and Monthly Growth Rate in the month of January 2026
|
Segment
|
Subscription
|
Broadband Subscribers
(in million)
|
Percentage Change
|
|
December 2025
|
January 2026
|
|
Wired subscribers
|
Fixed Wired Access
(DSL, FTTx, Ethernet/LAN, Cable Modem, ILL)
|
45.45
|
45.83
|
0.83%
|
|
Wireless Subscribers
|
Fixed Wireless Access
(5G FWA, Wi-Fi, Wi-Max, Radio/UBR, Satellite)
|
15.08
|
15.95
|
5.77%
|
|
Mobile Wireless Access
(Handset/Dongle-based-3G, 4G, 5G, M2M)
|
990.07
|
990.95
|
0.09%
|
|
Total Broadband Subscriptions
|
1050.60
|
1052.72
|
0.20%
|
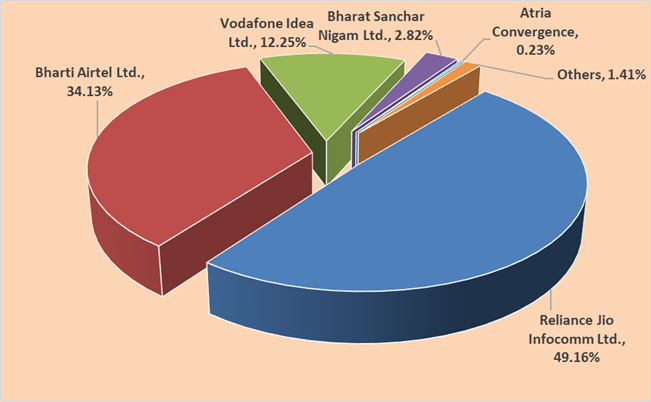
Top five Broadband (Wired & Wireless) Service providers as on 31st January
2026
|
S.N.
|
Service Provider
|
Subscriber base
(In million)
|
-
|
Reliance Jio Infocomm Ltd.
|
517.56
|
-
|
Bharti Airtel Ltd.
|
359.29
|
-
|
Vodafone Idea Ltd.
|
128.97
|
-
|
Bharat Sanchar Nigam Ltd.
|
29.64
|
-
|
Atria Convergence Technologies Ltd.
|
2.38
|
|
Market Share of Top Five Broadband (Wired & Wireless) Service Providers
|
98.59%
|
- The graphical representation of the service provider-wise market share of broadband services is given below: -
Service Provider-wise Market Share of Broadband (Wired & Wireless) Services as on 31st January 2026
Top Five Fixed Wired Access Broadband Service providers as on 31st January 2026
|
S.N.
|
Service Provider
|
Subscriber base
(In million)
|
-
|
Reliance Jio Infocomm Ltd.
|
13.99
|
-
|
Bharti Airtel Ltd.
|
10.38
|
-
|
Bharat Sanchar Nigam Ltd
|
4.47
|
-
|
Atria Convergence Technologies Ltd.
|
2.38
|
-
|
Kerala Vision Broadband Ltd.
|
1.46
|
|
Market Share of Top Five Fixed (Wired) Access Broadband Service Providers
|
71.30%
|
Top five Wireless (Fixed wireless & mobile) Access Broadband Service
providers as on 31st January 2026
|
S.N.
|
Service Provider
|
Subscriber base
(In million)
|
-
|
Reliance Jio Infocomm Ltd.
|
503.57
|
-
|
Bharti Airtel Ltd.
|
348.91
|
-
|
Vodafone Idea Ltd.
|
128.97
|
-
|
Bharat Sanchar Nigam Ltd.
|
25.17
|
-
|
IBus Virtual Network Services Private Limited
|
0.12
|
|
Market Share of Top Five Wireless (Fixed wireless & Mobile) Access Broadband Service providers
|
99.98%
|
- Wireline Telephone Subscriber Base
- The number of wireline subscribers increased from 47.37 million at the end of December 2025 to 47.66 million at the end of January 2026. The net increase in the wireline subscriber base was 0.29 million with a monthly growth rate of 0.61%.
- The overall wireline tele-density in India increased from 3.33% at the end of December 2025 to 3.34% at the of January 2026. Urban and rural wireline tele-density were 8.31% and 0.56% respectively, on 31st January 2026. The shares of urban and rural subscribers in total wireline subscribers were 89.36% and 10.64% respectively, at the end of January 2026.
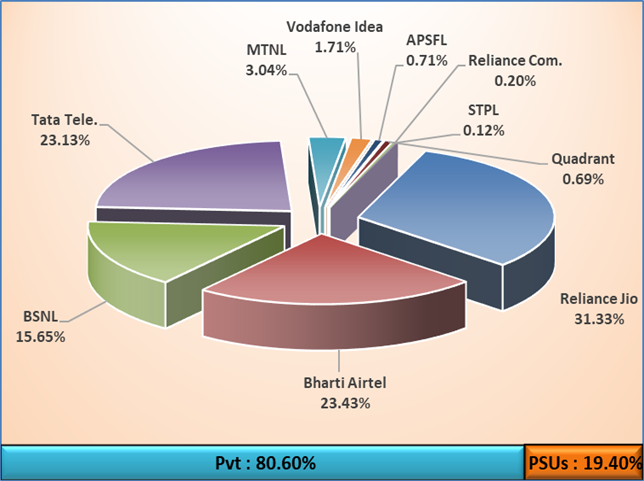
- PSU access service providers viz. BSNL, MTNL, and APSFL together held 19.40% of the wireline market share as on 31st January 2026. Detailed statistics of the wireline subscriber base are available at Annexure-I.
Access Service Provider-wise Market Share of wireline Subscribers as on 31st January 2026
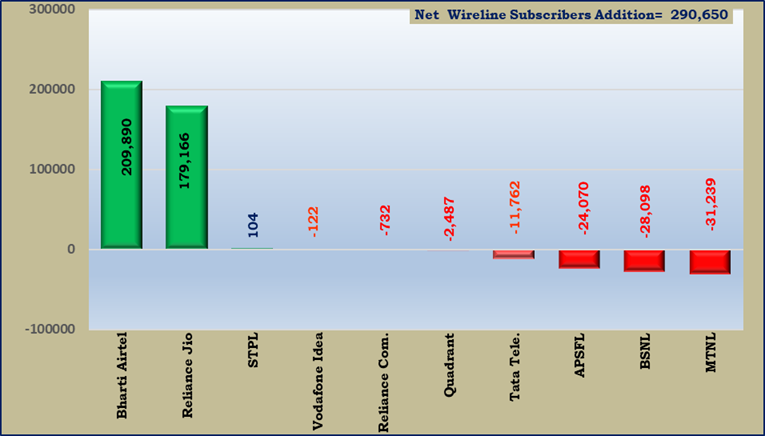
- The net addition/ decline in the wireline subscriber base of various access service providers in the month of January 2026 is given below:
Access Service Provider-wise Net Addition/Decline in Wireline Subscribers during the month of January 2026
- Wireless Telephone (Mobile + FWA) Subscriber Base
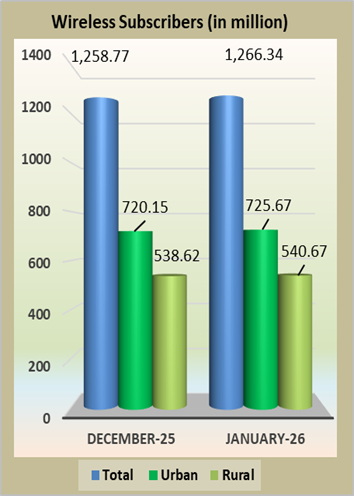
- The number of wireless (mobile + Fixed Wireless Access) subscribers increased from 1258.77 million at the end of December 2025 to 1266.34 million at the end of January 2026, thereby registering a monthly growth rate of 0.60%. Total wireless subscription in urban areas increased from 720.15 million on 31st December 2025 to 725.67 million on 31st January 2026. The subscription in rural areas also increased from 538.62 million to 540.67 million during the same period. The monthly growth rate of urban and rural wireless subscriptions was 0.77% and 0.38%, respectively.
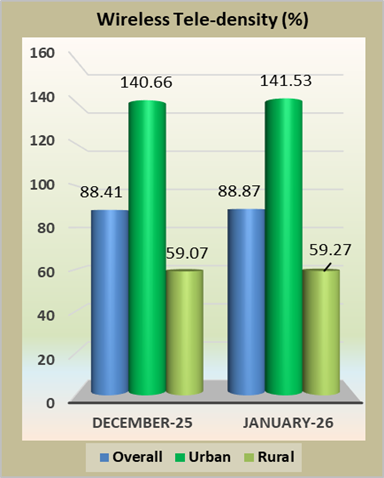
- The wireless tele-density in India increased from 88.41% at the end of December 2025 to 88.87% at the end of January 2026. The urban wireless tele-density increased from 140.66% at the end of December 2025 to 141.53% at the end of January 2026. The rural wireless tele-density increased from 59.07% to 59.27% during the same period. The share of urban and rural wireless subscribers in the total number of wireless subscribers was 57.30% and 42.70%, respectively, at the end of January 2026.
Note: In the calculation of Tele-density figures, M2M cellular mobile connections have also been considered.
- The details of wireless (mobile) subscribers and wireless (FWA) subscribers are given below:
(A) Wireless (mobile) subscriber Base
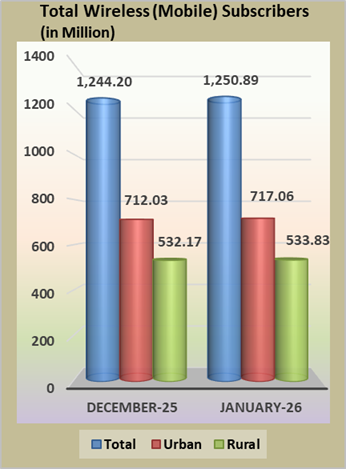
- The number of wireless (mobile) subscribers increased from 1244.20 million at the end of December 2025 to 1250.89 million at the end of January 2026 thereby registering a monthly growth rate of 0.54%. Wireless (mobile) subscription in urban areas increased from 712.03 million at the end of December 2025 to 717.06 million at the end of January 2026 and wireless (mobile) subscription in rural areas also increased from 532.17 million to 533.83 million during the same period. The monthly growth rates of urban and rural wireless (mobile) subscription were 0.71% and 0.31% respectively.
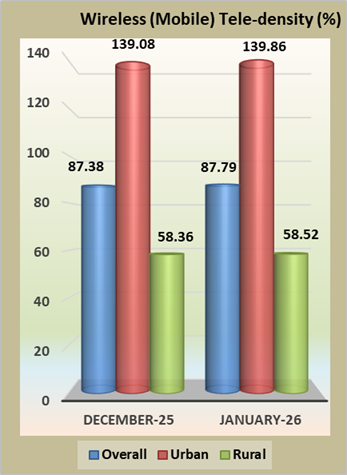
- The wireless (mobile) tele-density in India increased from 87.38% at the end of December 2025 to 87.79% at the end of January 2026. The urban wireless (mobile) tele-density increased from 139.08% at the end of December 2025 to 139.86% at the end of January 2026 and rural wireless (mobile) tele-density increased from 58.36% to 58.52% during the same period. The share of urban and rural wireless (mobile) subscribers in the total number of wireless (mobile) subscribers were 57.32% and 42.68% respectively, at the end of January 2026. The detailed statistics of wireless (mobile) subscriber base is available at Annexure-II.
Note: In the calculation of Tele-density figures, M2M cellular mobile connections have also been considered.
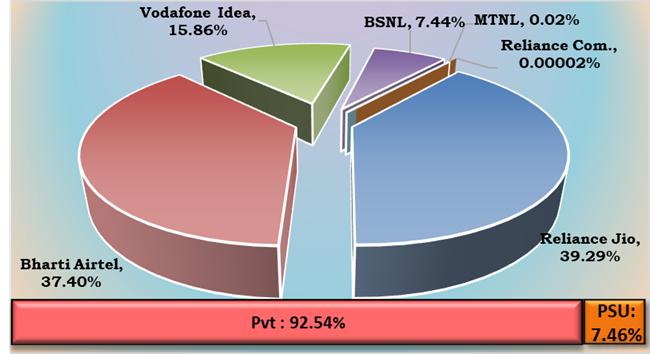
• As on 31st January 2026, the private access service providers held 92.54% of the market share in terms of wireless (mobile) subscribers, whereas PSU access service providers viz. BSNL and MTNL together held a market share of 7.46%.
- The graphical representation of access service provider-wise market share and net additions in wireless (mobile) subscriber base are given below: -
Access Service Provider-wise Market Shares in term of Wireless (Mobile) Subscribers as on 31st January 2026
Net Addition/ Decline in Wireless (Mobile) Subscribers of Access Service Providers in the month of January 2026
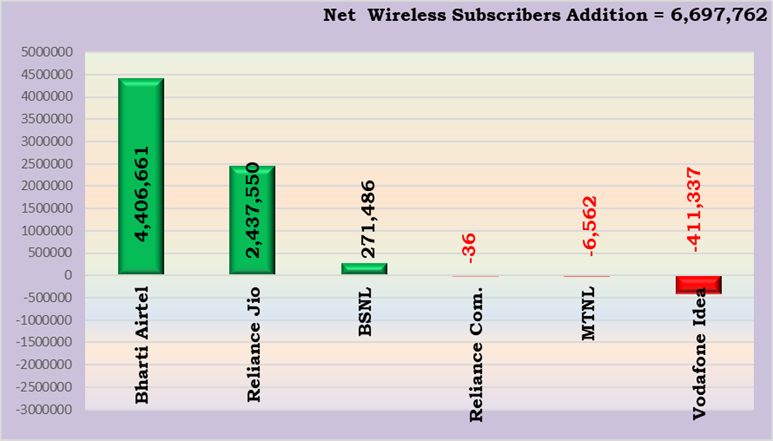
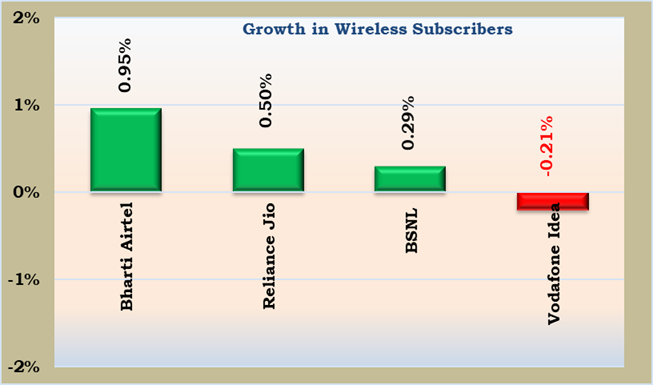
Growth in Wireless (Mobile) Subscribers
Major Access Service Provider-wise Monthly Growth/ Decline Rate of Wireless (Mobile) Subscribers in the month of January 2026
Licensed Service Area (LSA)-wise Monthly Growth/ Decline rate of Wireless (Mobile) Subscribers in the month of January 2026
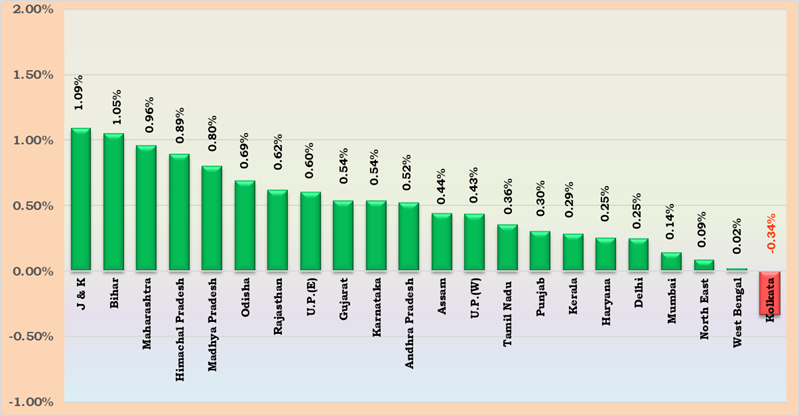
- Except Kolkata, all other LSAs have shown growth in their wireless (Mobile) subscribers during the month of January 2026.
(B) Wireless (FWA) subscriber Base
- At present, fixed wireless access (FWA) based services are being provided under two categories viz.
- 5G FWA i.e. FWA using 5G radio access technology; and
- UBR FWA i.e. FWA using Unlicensed Band Radio (UBR) technology.
- The number of wireless (5G FWA) subscribers increased from 10.99 million at the end of December 2025 to 11.53 million at the end of January 2026 with subscriptions in urban and rural areas as 5.83 million and 5.70 million respectively. The shares of urban and rural wireless (5G FWA) subscribers in total wireless (5G FWA) subscribers were 50.55% and 49.45% respectively, at the end of January 2026.
- LSA wise information on the wireless (5G FWA) subscriber base is available at Annexure-V.
- UBR FWA subscription stood at 3.92 million at the end of January 2026 with subscriptions in urban and rural areas of 2.78 million and 1.14 million respectively. The shares of urban and rural wireless (UBR FWA) subscribers in total wireless (UBR FWA) subscribers were 70.89% and 29.11% respectively, at the end of January 2026.
LSA wise information on the wireless (UBR FWA) subscriber base is available at Annexure-VI.
- M2M cellular mobile connections
The Number of M2M cellular mobile connections increased from 109.19 million at the end of December 2025 to 113.46 million at the end of January 2026.
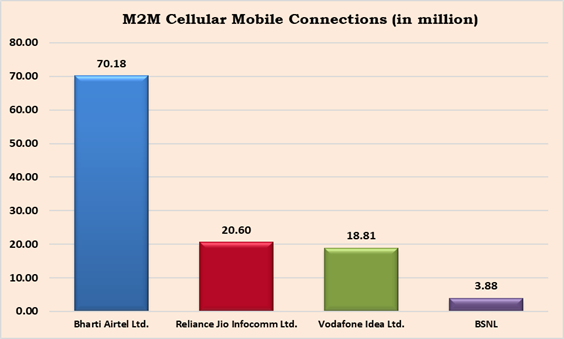
Bharti Airtel Limited has the highest number of M2M cellular mobile connections of 70.18 million with a market share of 61.85%, followed by Reliance Jio Infocomm Limited, Vodafone Idea Limited and BSNL with market share of 18.15%, 16.58% and 3.42% respectively. The bifurcation of service provider wise total M2M subscriptions and Broadband M2M subscriptions for the month of January 2026 is given below:
|
Service Provider
|
Total M2M (2G/3G/4G/5G) Subscriptions
(in Million)
|
Broadband M2M (3G/4G/5G) Subscriptions
(in Million)
|
|
Bharti Airtel Limited
|
70.17
|
40.03
|
|
Reliance Jio Infocomm Limited
|
20.60
|
20.60
|
|
Vodafone Idea Limited
|
18.8
|
7.69
|
|
BSNL
|
3.88
|
2.2
|
|
Total
|
113.46
|
70.52
|
Total Telephone Subscriber Base
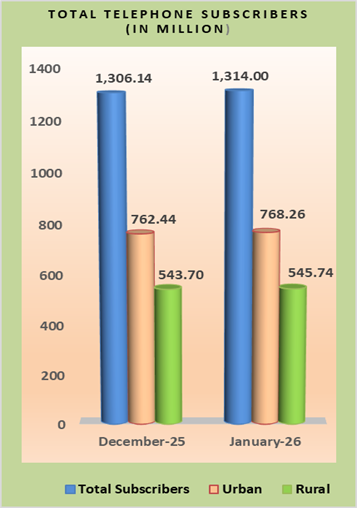
- The number of total telephone subscribers in India increased from 1306.14 million at the end of December 2025 to 1314.00 million at the end of January 2026, thereby showing a monthly growth rate of 0.60%. Urban telephone subscription increased from 762.44 million at the end of December 2025 to 768.26 million at the end of January 2026 and the rural telephone subscription also increased from 543.70 million to 545.74 million during the same period. The monthly growth rates of urban and rural telephone subscription were 0.76% and 0.38% respectively during the month of January 2026.
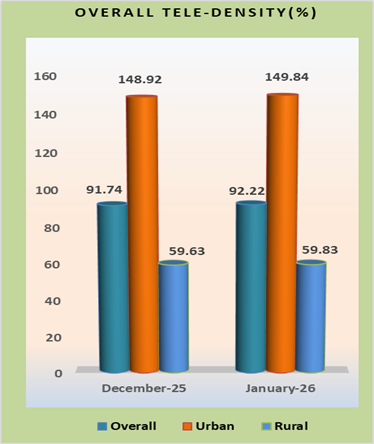
- The overall tele-density in India increased from 91.74% at the end of December 2025 to 92.22% at the end of January 2026. The urban tele-density increased from 148.92% at the end of December 2025 to 149.84% at the end of January 2026 and rural tele-density also increased from 59.63% to 59.83% during the same period. The share of urban and rural subscribers in total number of telephone subscribers at the end of January 2026 were 58.47% and 41.53% respectively.
Note: In the calculation of Tele-density figures, M2M cellular mobile connections have also been considered.
- A summary of total telephone subscriber base at the end of January 2026 is as below:
Telephone subscriber base as on 31st January 2026 (in million)
|
S. No.
|
Type of telephone connection
|
No. of subscribers
|
Total
|
|
1.
|
Wireless
|
Consumer SIM
|
1,137.43
|
1,266.34
|
|
2.
|
M2M SIM
|
113.46
|
|
3.
|
FWA
|
15.45
|
|
4.
|
Wireline
|
|
47.66
|
|
|
5.
|
Total
|
|
1,314.00
|
|
- The following table provides a summary information on wireless (mobile) telephone subscriber base as on 31st January 2026:
|
S. No.
|
Item
|
No. of subscribers
|
|
1.
|
No. of Wireless (mobile) connections including M2M cellular mobile connections *
|
1,250.89
|
|
2.
|
No. of Wireless (mobile) connections excluding M2M cellular mobile connections
|
1,137.43
|
* Wireless (mobile) connections = Consumer SIM + M2M SIM
Overall Tele-density (LSA Wise) – As on 31st January 2026
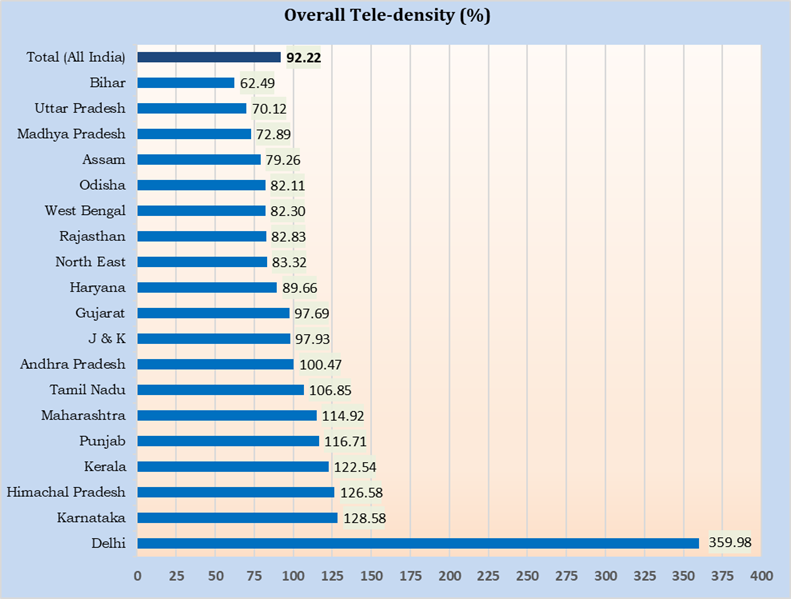
- As may be seen in the above chart, nine LSAs have less tele-density than the all-India average tele-density at the end of January 2026. Delhi LSA has the maximum tele-density of 359.98% and the Bihar LSA has the minimum tele-density of 62.49% at the end of January 2026.
Notes: -
- Population data/projections are available state wise only.
- Tele-density figures are derived from the telephone subscriber data provided by the access service providers and the projection of population from the “Report of the Technical Group on Population Projections for India and States 2011 – 2036.
- Telephone subscriber data for Delhi, includes, apart from the data for the State of Delhi, wireless subscriber data for the areas served by the local exchanges of Ghaziabad & Noida (in Uttar Pradesh) and Gurgaon & Faridabad (in Haryana).
- Data/information for West Bengal includes Kolkata, Maharashtra includes Mumbai and Uttar Pradesh includes UPE & UPW service areas.
- Data/information for Andhra Pradesh includes Telengana, Madhya Pradesh includes Chhatishgarh, Bihar includes Jharkhand, Maharashtra includes Goa, Uttar Pradesh includes Uttarakhand, West Bengal includes Sikkim and North-East includes Arunachal Pradesh, Manipur, Meghalaya, Mizoram, Nagaland & Tripura States.
- In the calculation of Tele-density figures, M2M cellular mobile connections have also been included.
- Category-wise Growth in subscriber base
Circle Category-wise Net Additions in Telephone Subscribers in the Month January 2026
|
Circle
Category
|
Net additions in the month of January 2026
|
Telephone Subscriber base as on 31st January 2026
|
|
Wireline segment
|
Wireless* segment
|
Wireline segment
|
Wireless* segment
|
|
Circle A
|
88,736
|
2,792,442
|
20,246,256
|
424,604,391
|
|
Circle B
|
151,789
|
2,687,647
|
11,682,665
|
493,418,338
|
|
Circle C
|
43,407
|
1,850,566
|
3,571,722
|
209,282,801
|
|
Metro
|
6,718
|
240,258
|
12,158,198
|
139,034,730
|
|
All India
|
290,650
|
7,570,913
|
47,658,841
|
1,266,340,260
|
Circle Category-wise Monthly and Yearly Growth Rates in
Telephone Subscribers in the Month of December 2025
|
Circle Category
|
Monthly growth rate (%) (December 2025 to January 2026)
|
Yearly growth rate (%) (January 2025 to January 2026)
|
|
Wireline Segment
|
Wireless* Segment
|
Wireline Segment
|
Wireless* Segment
|
|
Circle A
|
0.44%
|
0.66%
|
49.54%
|
8.29%
|
|
Circle B
|
1.32%
|
0.55%
|
22.81%
|
5.12%
|
|
Circle C
|
1.23%
|
0.89%
|
30.12%
|
8.72%
|
|
Metro
|
0.06%
|
0.17%
|
31.73%
|
6.66%
|
|
All India
|
0.61%
|
0.60%
|
36.06%
|
6.92%
|
* The wireless subscriber base comprises of wireless mobile telephone subscribers (including M2M cellular mobile connections), and FWA subscribers.
Note: Circle Category-Metro includes Delhi, Mumbai and Kolkata.
- As can be seen in the above tables, in the wireless segment, during the month of January 2026, on a monthly basis, all circles have registered a growth in their subscriber bases. On a yearly basis also, all the circles have registered a growth in their wireless subscriber bases.
- In the wireline segment, during the month of January 2026, on a monthly basis, all circles have registered a growth in their subscribers. On a yearly basis also, all circles have registered a growth in their wireline subscriber bases.