Ministry of Commerce & Industry
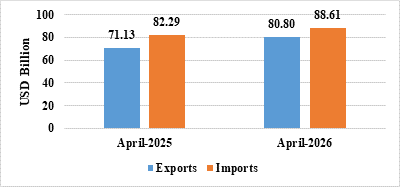
Total exports (merchandise & services) during April 2026 is estimated at US$ 80.80 Billion, as compared to US$ 71.13 Billion during April 2025, an estimated growth of 13.59 %
Merchandise exports during April 2026 were US$ 43.56 Billion, as compared to US$ 38.28 Billion during April 2025, registering a positive growth of 13.78%
Non-Petroleum exports during April 2026 valued at US$ 33.97 Billion registered an increase of 9.01% as compared to US$ 31.16 Billion during April 2025
Major drivers of merchandise exports growth in April 2026 include Petroleum Products, Electronic Goods, Engineering Goods, Meat, Dairy & Poultry Products and Drugs & Pharmaceuticals
Petroleum Products exports increased by 34.66 % from US$ 7.12 Billion in April 2025 to US$ 9.59 Billion in April 2026
Electronic Goods exports increased by 40.31 % from US$ 3.69 Billion in April 2025 to US$ 5.18 Billion in April 2026
Engineering Goods exports increased by 8.76 % from US$ 9.52 Billion in April 2025 to US$ 10.35 Billion in April 2026
Meat, Dairy & Poultry Products exports increased by 48.03 % from US$ 0.37 Billion in April 2025 to US$ 0.55 Billion in April 2026
Drugs & Pharmaceuticals exports increased by 7.12 % from US$ 2.49 Billion in April 2025 to US$ 2.66 Billion in April 2026
Posted On:
15 MAY 2026 3:36PM by PIB Delhi
India’s total exports (Merchandise and Services combined) for April 2026* is estimated at US$ 80.80 Billion, registering a positive growth of 13.59 percent vis-à-vis April 2025. Total imports (Merchandise and Services combined) for April 2026* is estimated at US$ 88.61 Billion, registering a positive growth of 7.67 percent vis-à-vis April 2025.
Table 1: Trade during April 2026*
|
|
|
April 2026
(US$ Billion)
|
April 2025
(US$ Billion)
|
|
Merchandise
|
Exports
|
43.56
|
38.28
|
|
Imports
|
71.94
|
65.38
|
|
Services*
|
Exports
|
37.24
|
32.85
|
|
Imports
|
16.66
|
16.91
|
|
Total Trade
(Merchandise +Services) *
|
Exports
|
80.80
|
71.13
|
|
Imports
|
88.61
|
82.29
|
|
Trade Balance
|
-7.81
|
-11.16
|
* Note: The latest data for services sector released by RBI is for March 2026. The data for April 2026 is an estimation. (ii) Data for April 2025 has been revised on pro-rata basis using quarterly balance of payments data.
Fig 1: Total Trade during April 2026*
MERCHANDISE TRADE
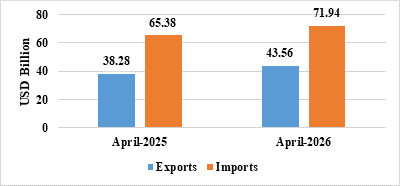
- Merchandise exports during April 2026 were US$ 43.56 Billion as compared to US$ 38.28 Billion in April 2025.
- Merchandise imports during April 2026 were US$ 71.94 Billion as compared to US$ 65.38 Billion in April 2025.
Fig 2: Merchandise Trade during April 2026
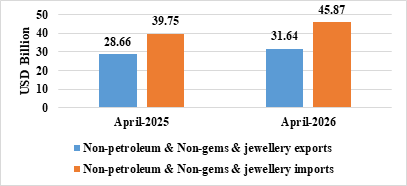
- Non-petroleum and non-gems & jewellery exports in April 2026 were US$ 31.64 Billion compared to US$ 28.66 Billion in April 2025.
- Non-petroleum, non-gems & jewellery (gold, silver & precious metals) imports in April 2026 were US$ 45.87 Billion compared to US$ 39.75 Billion in April 2025.
Table 2: Trade excluding Petroleum and Gems & Jewellery during April 2026
|
|
April 2026
(US$ Billion)
|
April 2025 (US$ Billion)
|
|
Non- petroleum exports
|
33.97
|
31.16
|
|
Non- petroleum imports
|
53.32
|
44.68
|
|
Non-petroleum & Non-Gems & Jewellery exports
|
31.64
|
28.66
|
|
Non-petroleum & Non-Gems & Jewellery imports
|
45.87
|
39.75
|
Note: Gems & Jewellery Imports include Gold, Silver & Pearls, precious & Semi-precious stones
Fig 3: Trade excluding Petroleum and Gems & Jewellery during April 2026
SERVICES TRADE
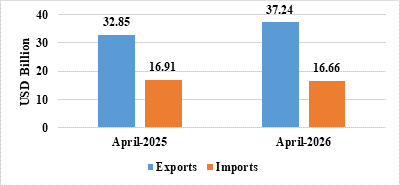
- The estimated value of services export for April 2026* is US$ 37.24 Billion as compared to US$ 32.85 Billion in April 2025.
- The estimated value of services imports for April 2026* is US$ 16.66 Billion as compared to US$ 16.91 Billion in April 2025.
Fig 4: Services Trade during April 2026*
- Exports of Other Cereals (210.19%), Meat, Dairy & Poultry Products (48.03%), Electronic Goods (40.31%), Petroleum Products (34.66%), Handicrafts Excl. Hand Made Carpet (26.21%), Marine Products (14.74%), Mica, Coal & Other Ores, Minerals Including Processed Minerals (13.85%), Iron Ore (11.46%), Oil Seeds (11.32%), Carpet (9.93%), Engineering Goods (8.76%), Coffee (7.51%), Organic & Inorganic Chemicals (7.31%), Drugs & Pharmaceuticals (7.12%), Plastic & Linoleum (5.28%), Man-Made Yarn/Fabs./Made-Ups Etc. (2.34%), Cotton Yarn/Fabs./Made-Ups, Handloom Products Etc. (0.57%) and Leather & Leather Products (0.36%) record positive growth during April 2026 over the corresponding month of last year.
- Imports of Chemical Material & Products (-35.4%), Pulses (-29.69%), Pearls, Precious & Semi-Precious Stones (-15.96%), Newsprint (-12.54%), Petroleum, Crude & Products (-10.03%), Wood & Wood Products (-8.36%), Textile Yarn Fabric, Made-Up Articles (-7.17%), Cotton Raw & Waste (-6.1%), Iron & Steel (-4.71%), Machine Tools (-0.73%) and Pulp And Waste Paper (-0.24%) record negative growth during April 2026 over the corresponding month of last year.
- Services exports is estimated to grow by 13.36 percent during April 2026* over April 2025.
- Top 5 export destinations, in terms of change in value, exhibiting positive growth in April 2026 vis a vis April 2025 are Singapore (179.18%), Tanzania Rep (157.63%), Sri Lanka Dsr (214.65%), Bangladesh Pr (64.16%) & Hong Kong (90.61%).
- Top 5 import sources, in terms of change in value, exhibiting growth in April 2026 vis a vis April 2025 are China P Rp (20.85%), Russia (18.21%), Oman (246.42%), Peru (315.56%) & Saudi Arab (30.29%).
*Link for Quick Estimates
Exim Summery
***
Abhishek Dayal/ Abhijith Narayanan
(Release ID: 2261383)
Visitor Counter : 1042