|
Ministry of Communications
Highlights of Telecom Subscription Data at the end of April 2026
प्रविष्टि तिथि:
26 MAY 2026 8:12PM by PIB Delhi
|
Particulars
|
Wireless*
|
Wireline
|
Total
(Wireless+
Wireline)
|
|
Broadband Subscribers (Million)
|
1026.60
|
46.84
|
1073.44
|
|
Urban Telephone Subscribers (Million)
|
739.78
|
43.34
|
783.12
|
|
Net Addition in April 2026 (Million)
|
4.05
|
0.29
|
4.33
|
|
Monthly Growth Rate
|
0.55%
|
0.67%
|
0.56%
|
|
Rural Telephone Subscribers (Million)
|
549.18
|
5.23
|
554.41
|
|
Net Addition in April 2026 (Million)
|
2.58
|
0.04
|
2.62
|
|
Monthly Growth Rate
|
0.47%
|
0.76%
|
0.47%
|
|
Total Telephone Subscribers (Million)
|
1288.96
|
48.58
|
1337.54
|
|
Net Addition in April 2026 (Million)
|
6.63
|
0.33
|
6.95
|
|
Monthly Growth Rate
|
0.52%
|
0.68%
|
0.52%
|
|
Share of Urban Subscribers
|
57.39%
|
89.23%
|
58.55%
|
|
Share of Rural Subscribers
|
42.61%
|
10.77%
|
41.45%
|
|
Overall Tele-density@ with M2M cellular mobile connections
|
90.28%
|
3.40%
|
93.69%
|
|
Urban Tele-density@
|
143.69%
|
8.42%
|
152.11%
|
|
Rural Tele-density@
|
60.16%
|
0.57%
|
60.74%
|
|
Tele-density@ without M2M cellular mobile connections
|
81.36%
|
3.40%
|
84.76%
|
- In the month of April 2026, 14.74 million subscribers submitted their requests for Mobile Number Portability (MNP).
- The number of active wireless (mobile) subscribers (on the date of peak VLR#) in April 2026 was 1193.57 million.
__________________________________________________________________________________________________________________
Note:
* The wireless subscriber base comprises of wireless mobile telephone subscribers (including M2M cellular mobile connections), and FWA subscribers.
@ Tele-density has been computed on the basis of the projection of population from the ‘Report of the Technical Group on Population Projections for India and States 2011 – 2036’, published in July 2020.
# VLR is an acronym of Visitor Location Register. The dates of peak VLR for various Telecom Service Providers (TSPs) may be different in different service areas.
- Information in this press release is based on the data provided by the Telecom Service Providers (TSPs) to TRAI.
- Broadband Subscribers
- As per the information received from 1538 operators for the month of April 2026, the total number of broadband subscribers increased from 1065.88 million at the end of March 2026 to 1073.44 million at the end of April 2026 with a monthly growth rate of 0.71%. Segment-wise number of broadband subscribers and their monthly growth rates are as below: -
Segment–wise Broadband Subscribers and Monthly Growth Rate in the month of April 2026
|
Segment
|
Subscription
|
Broadband Subscribers
(in million)
|
Percentage Change
|
|
March 2026
|
April
2026
|
|
Wired subscribers
|
Fixed Wired Access
(DSL, FTTx, Ethernet/LAN, Cable Modem, ILL)
|
46.51
|
46.84
|
0.71%
|
|
Wireless Subscribers
|
Fixed Wireless Access
(5G FWA, Wi-Fi, Wi-Max, Radio/UBR, Satellite)
|
17.10
|
17.54
|
2.53%
|
|
Mobile Wireless Access
(Handset/Dongle/M2M-based-3G, 4G, 5G)
|
1002.27
|
1009.06
|
0.68%
|
|
Total Broadband Subscriptions
|
1065.88
|
1073.44
|
0.71%
|
Top five Broadband (Wired & Wireless) Service providers at the end of April 2026
|
S.N.
|
Service Provider
|
Subscriber base
(In million)
|
|
|
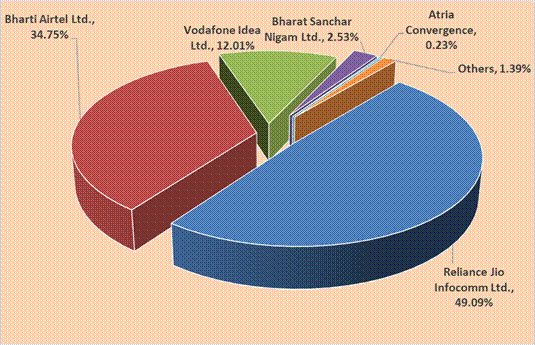
Reliance Jio Infocomm Ltd.
|
526.94
|
|
|
Bharti Airtel Ltd.
|
373.00
|
|
|
Vodafone Idea Ltd.
|
128.92
|
|
|
Bharat Sanchar Nigam Ltd.
|
27.20
|
|
|
Atria Convergence Technologies Ltd.
|
2.42
|
|
Market Share of Top Five Broadband (Wired & Wireless) Service Providers
|
98.61%
|
- The graphical representation of the service provider-wise market share of broadband services is given below: -
Service Provider-wise Market Share of Broadband (Wired & Wireless) Services at the end of April 2026
Top Five Fixed Wired Access Broadband Service providers at the end of April 2026
|
S.N.
|
Service Provider
|
Subscriber base
(In million)
|
|
|
Reliance Jio Infocomm Ltd.
|
14.35
|
|
|
Bharti Airtel Ltd.
|
10.86
|
|
|
Bharat Sanchar Nigam Ltd.
|
4.51
|
|
|
Atria Convergence Technologies Ltd.
|
2.42
|
|
|
Kerala Vision Broadband Ltd.
|
1.50
|
|
Market Share of Top Five Fixed (Wired) Access Broadband Service Providers
|
71.81%
|
Top five Wireless (Fixed wireless & mobile) Access Broadband Service providers at the end of April 2026
|
S.N.
|
Service Provider
|
Subscriber base
(In million)
|
|
|
Reliance Jio Infocomm Ltd.
|
512.58
|
|
|
Bharti Airtel Ltd.
|
362.14
|
|
|
Vodafone Idea Ltd.
|
128.91
|
|
|
Bharat Sanchar Nigam Ltd.
|
22.69
|
|
|
IBus Virtual Network Services Private Limited
|
0.12
|
|
Market Share of Top Five Wireless (Fixed wireless & Mobile) Access Broadband Service providers
|
99.99%
|
- Wireline Telephone Subscriber Base
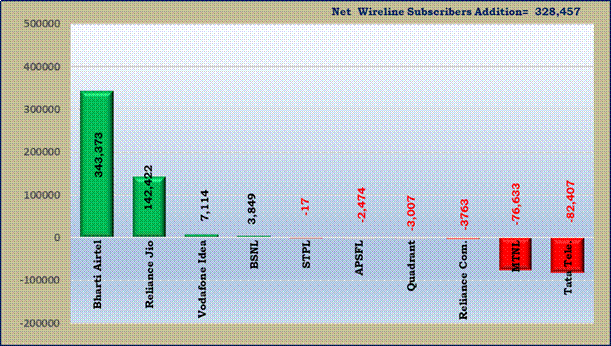
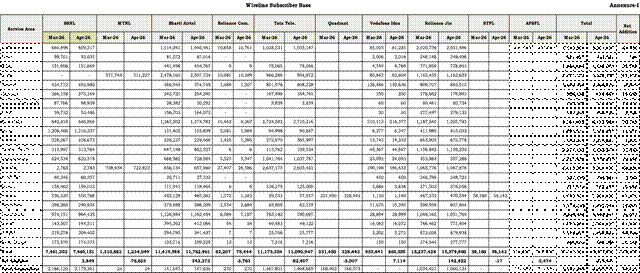
- The number of wireline subscribers increased from 48.25 million at the end of March 2026 to 48.58 million at the end of April 2026. The net increase in the wireline subscriber base was 0.33 million with a monthly growth rate of 0.68%.
- The overall wireline tele-density in India increased from 3.38% at the end of March 2026 to 3.40% at the of April 2026. Urban and rural wireline tele-density were 8.42% and 0.57% respectively, at the end of April 2026. The respective share of urban subscribers, and rural subscribers in total wireline subscribers were 89.23% and 10.77% respectively at the end of April 2026.
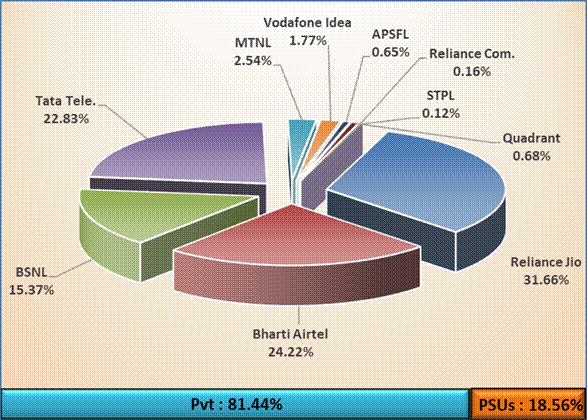
- PSU access service providers viz. BSNL, MTNL, and APSFL together held 18.56% of the wireline market share at the end of April 2026. Detailed statistics of the wireline subscriber base are available at Annexure-I.
Access Service Provider-wise Market Share of wireline Subscribers at the end of April 2026
- The net addition/ decline in the wireline subscriber base of various access service providers in the month of April 2026 is given below:
Access Service Provider-wise Net Addition/Decline in Wireline Subscribers during the month of April 2026
- Wireless Telephone (Mobile + FWA) Subscriber Base
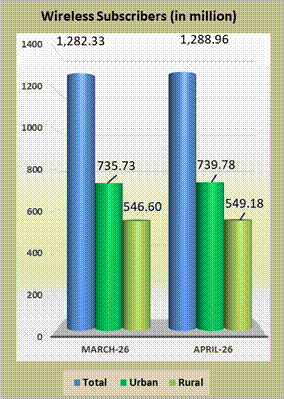
- The number of wireless (mobile + Fixed Wireless Access) subscribers increased from 1282.33 million at the end of March 2026 to 1288.96 million at the end of April 2026, thereby registering a monthly growth rate of 0.52%. Total wireless subscription in urban areas increased from 735.73 million on 31st March 2026 to 739.78 million on 30th April 2026. The subscription in rural areas also increased from 546.60 million to 549.18 million during the same period. The monthly growth rate of urban and rural wireless subscriptions was 0.55% and 0.47%, respectively.
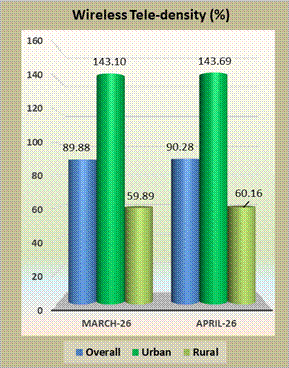
- The wireless tele-density in India increased from 89.88% at the end of March 2026 to 90.28% at the end of April 2026. The urban wireless tele-density increased from 143.10% at the end of March 2026 to 143.69% at the end of April 2026. The rural wireless tele-density increased from 59.89% to 60.16% during the same period. The share of urban and rural wireless subscribers in the total number of wireless subscribers was 57.39% and 42.61%, respectively, at the end of April 2026.
Note: In the calculation of Tele-density figures, M2M cellular mobile connections have also been included.
- The details of wireless (mobile) subscribers and wireless (FWA) subscribers are given below:
(A) Wireless (mobile) subscriber Base
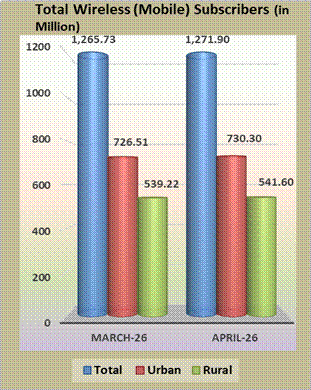
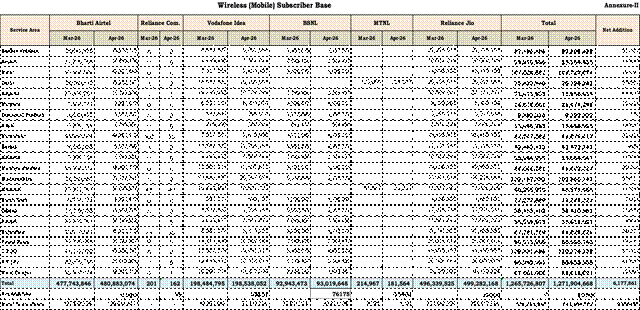
- The number of wireless (mobile) subscribers increased from 1265.73 million at the end of March 2026 to 1271.90 million at the end of April 2026 thereby registering a monthly growth rate of 0.49%. Wireless (mobile) subscription in urban areas increased from 726.51 million at the end of March 2026 to 730.30 million at the end of April 2026 and wireless (mobile) subscription in rural areas also increased from 539.22 million to 541.60 million during the same period. The monthly growth rates of urban and rural wireless (mobile) subscription were 0.52% and 0.44% respectively.
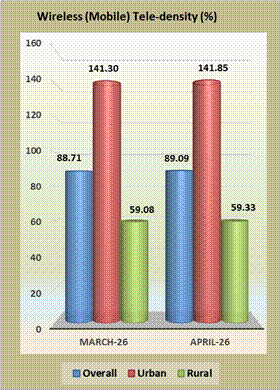
- The wireless (mobile) tele-density in India increased from 88.71% at the end of March 2026 to 89.09% at the end of April 2026. The urban wireless (mobile) tele-density increased from 141.30% at the end of March 2026 to 141.85% at the end of April 2026 and rural wireless (mobile) tele-density increased from 59.08% to 59.33% during the same period. The share of urban and rural wireless (mobile) subscribers in the total number of wireless (mobile) subscribers were 57.42% and 42.58% respectively, at the end of April 2026. The detailed statistics of wireless (mobile) subscriber base is available at Annexure-II.
Note: In the calculation of Tele-density figures, M2M cellular mobile connections have also been included.
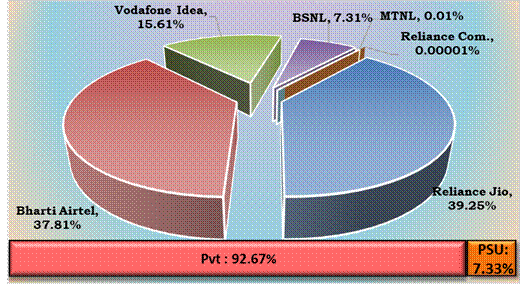
• At the end of April 2026, the private access service providers held 92.67% of the market share in terms of wireless (mobile) subscribers, whereas PSU access service providers viz. BSNL and MTNL together held a market share of 7.33%.
- The graphical representation of access service provider-wise market share and net additions in wireless (mobile) subscriber base are given below: -
Access Service Provider-wise Market Shares in term of Wireless (Mobile) Subscribers at the end of April 2026
Net Addition/ Decline in Wireless (Mobile) Subscribers of Access Service Providers in the month of April 2026
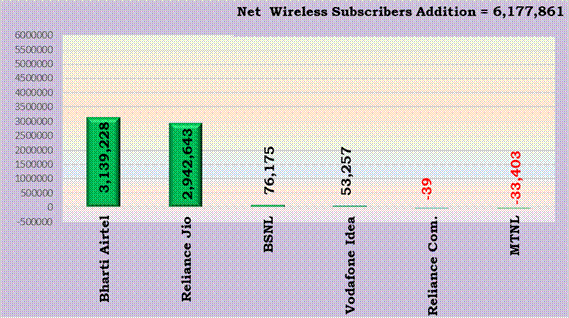
Growth in Wireless (Mobile) Subscribers
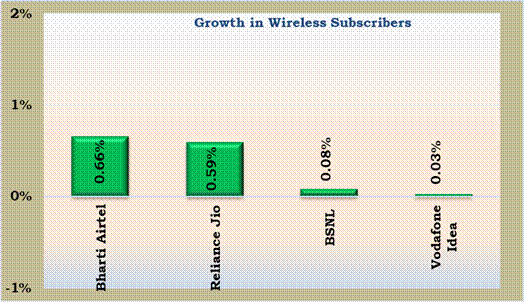
Major Access Service Provider-wise Monthly Growth/ Decline Rate of Wireless (Mobile) Subscribers in the month of April 2026
Licensed Service Area (LSA)-wise Monthly Growth/ Decline rate of Wireless (Mobile) Subscribers in the month of April 2026
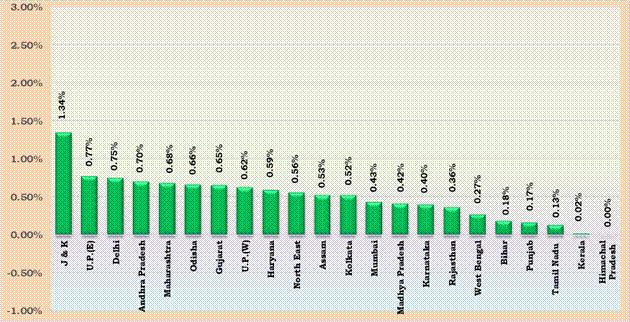
- All LSAs have shown growth in their wireless (Mobile) subscribers during the month of April 2026.
(B) Wireless (FWA) subscriber Base
- At present, fixed wireless access (FWA) based services are being provided under two categories viz.
- 5G FWA i.e. FWA using 5G radio access technology; and
- UBR FWA i.e. FWA using Unlicensed Band Radio (UBR) technology.
- The number of total wireless FWA using 5G radio access technology (5G FWA) subscribers increased from 12.32 million at the end of March 2026 to 12.55 million at the end of April 2026 with subscriptions in urban and rural areas as 6.26 million and 6.29 million respectively. The shares of urban and rural wireless (5G FWA) subscribers in total wireless (5G FWA) subscribers were 49.90% and 50.10% respectively, at the end of April 2026.
- LSA wise information on the wireless (5G FWA) subscriber base is available at Annexure-V.
- The number of total wireless FWA using UBR technology (UBR FWA) subscription stood at 4.51 million at the end of April 2026 with subscriptions in urban and rural areas of 3.21 million and 1.29 million respectively. The shares of urban and rural wireless (UBR FWA) subscribers in total wireless (UBR FWA) subscribers were 71.35% and 28.65% respectively, at the end of April 2026.
- LSA wise information on the wireless (UBR FWA) subscriber base is available at Annexure-VI.
- M2M cellular mobile connections
- The Number of M2M cellular mobile connections increased from 123.88 million at the end of March 2026 to 127.48 million at the end of April 2026.
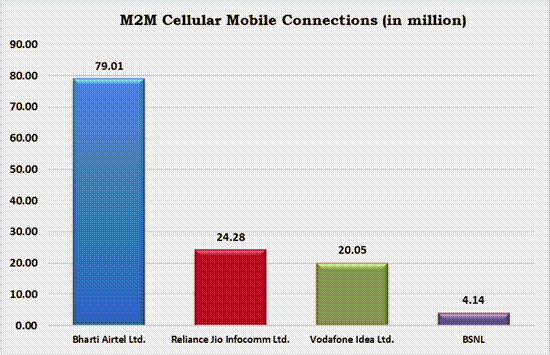
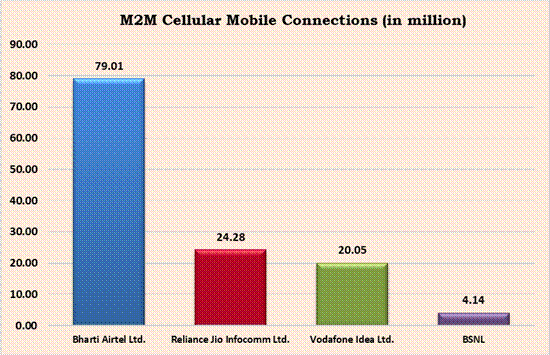
- Bharti Airtel Limited has the highest number of M2M cellular mobile connections of 79.01 million with a market share of 61.98%, followed by Reliance Jio Infocomm Limited, Vodafone Idea Limited and BSNL with market share of 19.05%, 15.73% and 3.25% respectively.
- Total Telephone Subscriber Base
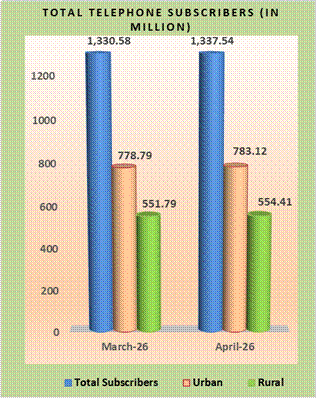
- The number of total telephone subscribers in India increased from 1330.58 million at the end of March 2026 to 1337.54 million at the end of April 2026, thereby showing a monthly growth rate of 0.52%. Urban telephone subscription increased from 778.79 million at the end of March 2026 to 783.12 million at the end of April 2026 and the rural telephone subscription also increased from 551.79 million to 554.41 million during the same period. The monthly growth rates of urban and rural telephone subscription were 0.56% and 0.47% respectively during the month of April 2026.
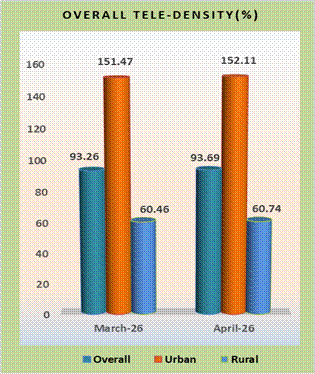
- The overall tele-density in India increased from 93.26% at the end of March 2026 to 93.69% at the end of April 2026. The urban tele-density increased from 151.47% at the end of March 2026 to 152.11% at the end of April 2026 and rural tele-density also increased from 60.46% to 60.74% during the same period. The share of urban and rural subscribers in total number of telephone subscribers at the end of April 2026 were 58.55% and 41.45% respectively.
Note: In the calculation of Tele-density figures, M2M cellular mobile connections have also been included.
- A summary of total telephone subscriber base at the end of April 2026 is as below:
Telephone subscriber base at the end of April 2026 (in million)
|
S. No.
|
Type of telephone connection
|
No. of subscribers
|
Total
|
|
1.
|
Wireless
|
Consumer SIM
|
1,144.42
|
1,288.96
|
|
2.
|
M2M SIM
|
127.48
|
|
3.
|
FWA
|
17.06
|
|
4.
|
Wireline
|
48.58
|
|
|
5.
|
Total
|
1,337.54
|
|
- The following table provides a summary information on wireless (mobile) telephone subscriber base at the end of April 2026:
|
S. No.
|
Item
|
No. of subscribers (in million)
|
|
1.
|
No. of Wireless (mobile) connections including M2M cellular mobile connections *
|
1,288.96
|
|
2.
|
No. of Wireless (mobile) connections excluding M2M cellular mobile connections
|
1,144.42
|
* Wireless (mobile) connections = Consumer SIM + M2M SIM
Overall Tele-density (LSA Wise) – At the end of April 2026
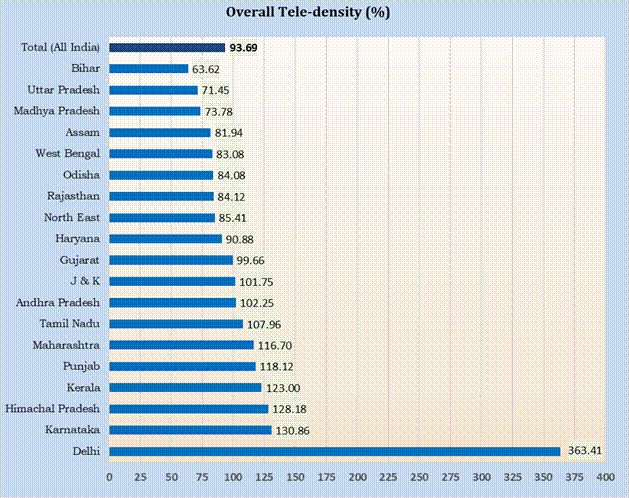
- As may be seen in the above chart, nine LSAs have less tele-density than the all-India average tele-density at the end of April 2026. Delhi LSA has the maximum tele-density of 363.41% and the Bihar LSA has the minimum tele-density of 63.62% at the end of April 2026.
Notes: -
- Population data/projections are available state wise only.
- Tele-density figures are derived from the telephone subscriber data provided by the access service providers and the projection of population from the “Report of the Technical Group on Population Projections for India and States 2011 – 2036 published in July 2020.
- Telephone subscriber data for Delhi, includes, apart from the data for the State of Delhi, wireless subscriber data for the areas served by the local exchanges of Ghaziabad & Noida (in Uttar Pradesh) and Gurgaon & Faridabad (in Haryana).
- Data/information for West Bengal includes Kolkata, Maharashtra includes Mumbai and Uttar Pradesh includes UPE & UPW service areas.
- Data/information for Andhra Pradesh includes Telengana, Madhya Pradesh includes Chhatishgarh, Bihar includes Jharkhand, Maharashtra includes Goa, Uttar Pradesh includes Uttarakhand, West Bengal includes Sikkim and North-East includes Arunachal Pradesh, Manipur, Meghalaya, Mizoram, Nagaland & Tripura States.
- In the calculation of Tele-density figures, M2M cellular mobile connections have also been included.
- Category-wise Growth in subscriber base
Circle Category-wise Net Additions in Telephone Subscribers in the Month of April 2026
|
Circle
Category
|
Net additions in the month of April 2026
|
Telephone Subscriber base at the end of April 2026
|
|
Wireline segment
|
Wireless* segment
|
Wireline segment
|
Wireless* segment
|
|
Circle A
|
195,368
|
2,356,239
|
20,840,286
|
432,097,286
|
|
Circle B
|
166,467
|
2,430,239
|
11,996,686
|
501,194,140
|
|
Circle C
|
54,202
|
928,492
|
3,730,058
|
214,525,663
|
|
Metro
|
-87,580
|
910,822
|
12,008,533
|
141,142,873
|
|
All India
|
328,457
|
6,625,792
|
48,575,563
|
1,288,959,962
|
Circle Category-wise Monthly and Yearly Growth Rates in Telephone Subscribers in the Month of April 2026
|
Circle Category
|
Monthly growth rate (%) (March 2026 to April 2026)
|
Yearly growth rate (%) (April 2025 to April 2026)
|
|
Wireline Segment
|
Wireless* Segment
|
Wireline Segment
|
Wireless* Segment
|
|
Circle A
|
0.95%
|
0.55%
|
41.85%
|
8.41%
|
|
Circle B
|
1.41%
|
0.49%
|
16.17%
|
5.46%
|
|
Circle C
|
1.47%
|
0.43%
|
24.13%
|
9.07%
|
|
Metro
|
-0.72%
|
0.65%
|
27.91%
|
5.95%
|
|
All India
|
0.68%
|
0.52%
|
29.84%
|
7.08%
|
* The wireless subscriber base comprises of wireless mobile telephone subscribers (including M2M cellular mobile connections), and FWA subscribers.
Note: Circle Category-Metro includes Delhi, Mumbai and Kolkata.
- As can be seen in the above tables, in the wireless segment, during the month of April 2026, on a monthly basis, all circles have registered a growth in their subscriber bases. On a yearly basis also, all the circles have registered a growth in their wireless subscriber bases.
- In the wireline segment, during the month of April 2026, on a monthly basis, all circles except ‘Metro’, have registered a growth in their subscribers. On a yearly basis, all circles have registered a growth in their wireline subscriber bases.
- Active Wireless (Mobile) Subscribers (VLR Data)
|
|
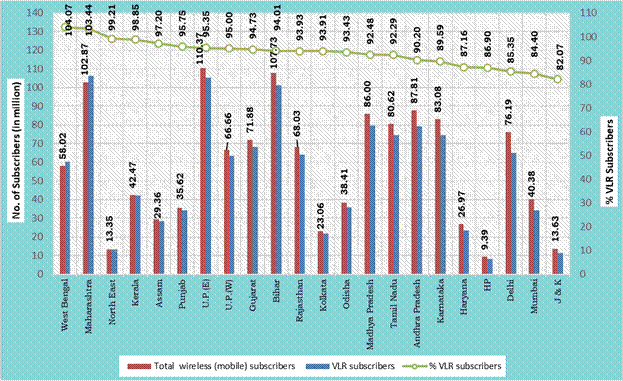
- Out of the total 1271.90 million wireless (mobile) subscribers, 1193.57 million wireless (mobile) subscribers were active on the date of peak VLR in the month of April 2026. The proportion of active wireless (mobile) subscribers was approximately 93.84% of the total wireless (mobile) subscriber base.
- The detailed statistics on the proportion of active wireless (mobile) subscribers (also referred to as VLR subscribers) on the date of peak VLR in the month of April 2026 is available at Annexure-III and the methodology used for reporting VLR subscribers is available at Annexure-IV.
Percentage of VLR Subscribers for the Top Four Access Service Providers in the month of April 2026
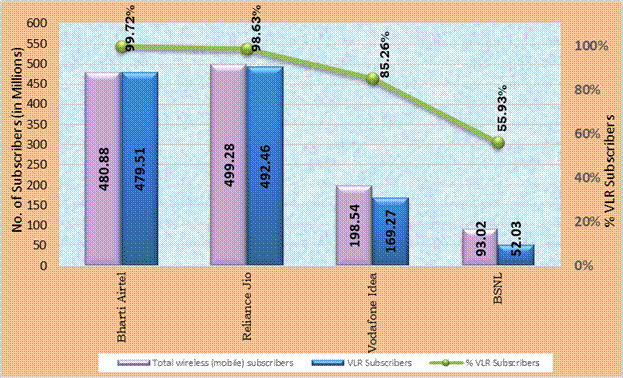
- Bharti Airtel has the maximum proportion- 99.72% of its active wireless (mobile) subscribers (VLR) as against its total wireless (mobile) subscribers (HLR) on the date of peak VLR in the month of April 2026.
Service Area wise percentage of VLR Subscribers in the month of April 2026
- Mobile Number Portability (MNP)
- MNP was implemented in Haryana Licensed Service Area (LSA) with effect from 25.11.2010 and across the rest of the country with effect from 20.01.2011. Initially, it was available only within the same LSA. Inter-LSA MNP was introduced nationwide with effect from 03.07.2015, enabling wireless subscribers to retain their mobile numbers when they relocate from one LSA to another.
- During the month of April 2026, about 14.74 million subscribers submitted their requests for MNP. Out of total requests, number of requests received from Zone-I & Zone-II were about 8.24 million and 6.50 million respectively.
- In MNP Zone-I (Northern and Western India), the highest number of requests have been received in UP(East) LSA (2.14 million) followed by U.P.(West) LSA (1.51 million).
- In MNP Zone-II (Southern and Eastern India), the highest number of requests have been received in Madhya Pradesh LSA (1.343 million) followed by Bihar LSA (1.335 million).
|
Licensed Service Area Wise MNP Status (in million)
|
|
Zone-I
|
Zone–II
|
|
Service Area
|
Number of Porting Requests in
the month of
|
Service Area
|
Number of Porting Requests in
the month of
|
|
March-26
|
April-26
|
March-26
|
April-26
|
|
Delhi
|
0.60
|
0.63
|
Andhra Pradesh
|
0.63
|
0.61
|
|
Gujarat
|
0.93
|
1.01
|
Assam
|
0.13
|
0.13
|
|
Haryana
|
0.43
|
0.41
|
Bihar
|
1.32
|
1.34
|
|
Himachal Pradesh
|
0.06
|
0.06
|
Karnataka
|
0.55
|
0.54
|
|
Jammu & Kashmir
|
0.08
|
0.09
|
Kerala
|
0.23
|
0.23
|
|
Maharashtra
|
0.92
|
0.97
|
Kolkata
|
0.17
|
0.18
|
|
Mumbai
|
0.25
|
0.26
|
Madhya Pradesh
|
1.40
|
1.34
|
|
Punjab
|
0.39
|
0.39
|
North East
|
0.04
|
0.04
|
|
Rajasthan
|
0.75
|
0.79
|
Odisha
|
0.25
|
0.24
|
|
U.P.(East)
|
2.14
|
2.14
|
Tamil Nadu
|
0.63
|
0.52
|
|
U.P.(West)
|
1.49
|
1.51
|
West Bengal
|
1.26
|
1.33
|
|
Total
|
8.03
|
8.24
|
Total
|
6.61
|
6.50
|
|
Total (Zone-I + Zone-II)
|
14.63
|
14.74
|
|
Contact details in case of any clarification: -
Shri Akhilesh Kumar Trivedi, Advisor (NSL-II),
Telecom Regulatory Authority of India
World Trade Centre, Tower-F,
Nauroji Nagar, New Delhi – 110029
Ph: 011-20907758 (Arun Agarwal)
E-mail: advmn@trai.gov.in Pr. Advisor (NSL), TRAI
|
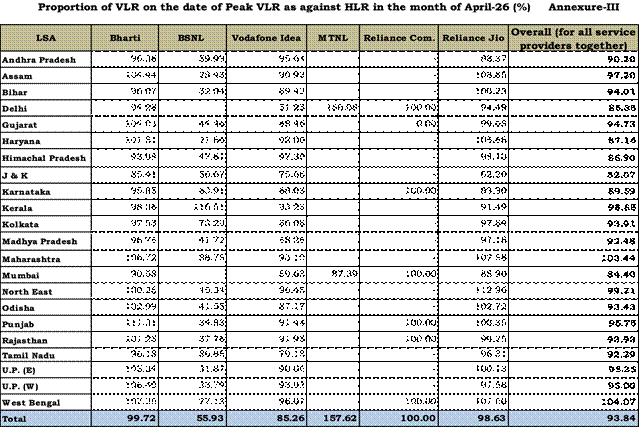
Note: Peak VLR figures in some LSAs of some of the service providers are more than their HLR figures due to a large number of inroamers.
Annexure IV
VLR Subscribers in the Wireless Segment
Home Location Register (HLR) is a central database that contains details of each mobile phone subscriber that is authorized to use the GSM core network. The HLRs store details of every SIM card issued by the service provider. Each SIM has a unique identifier called an International Mobile Subscriber Identity (IMSI), which is the primary key to each HLR record. The HLR data is stored for as long as a subscriber remains with the service provider. HLR also manages the mobility of subscribers by means of updating their position in administrative areas. It sends the subscriber data to a Visitor Location Register (VLR).
Subscriber numbers reported by the service providers is the difference between the numbers of IMSI registered in service provider’s HLR and sum of other figures as given below: -
|
1
|
Total IMSI's in HLR (A)
|
|
2
|
Less: (B = a + b + c + d + e)
|
|
a.
|
Test/Service Cards
|
|
b.
|
Employees
|
|
c.
|
Stock in hand/in Distribution Channels (Active Card)
|
|
d.
|
Subscriber Retention period expired
|
|
e.
|
Service suspended pending disconnection
|
|
3
|
Subscribers Base (A-B)
|
Visitor Location Register (VLR) is a temporary database of the subscribers who have roamed into the particular area, which it serves. Each base station in the network is served by exactly one VLR; hence a subscriber cannot be present in more than one VLR at a time.
If subscriber is in active stage i.e. he is able to send/receive calls/SMSs he is available both in HLR and VLR. However, it may be possible that the subscriber is registered in HLR but not in VLR due to the reason that he is either switched-off or moved out of coverage area, not reachable etc. In such circumstances he will be available in HLR but not in VLR. This causes difference between subscriber number reported by the service providers based on HLR and numbers available in VLR.
The VLR subscriber data calculated here is based on active subscribers in VLR on the date of Peak subscriber number in VLR of the particular month for which the data is being collected. This data is to be taken from the switches having the purge time of not more than 72 hours.
Fixed-Wireless (5G) Subscribers Base
Annexure-V
|
5G-Fixed Wireless Subscribers
|
|
TSPs Name →
|
Bharti Airtel
|
Reliance Jio
|
Grand Total
|
|
↓Telecom Service Area
|
Mar-26
|
Apr-26
|
Mar-26
|
Apr-26
|
Mar-26
|
Apr-26
|
|
Andhra Pradesh
|
326,398
|
323,724
|
733,617
|
752,750
|
1,060,015
|
1,076,474
|
|
Assam
|
80,832
|
81,383
|
204,410
|
208,854
|
285,242
|
290,237
|
|
Bihar
|
191,521
|
192,357
|
719,098
|
741,091
|
910,619
|
933,448
|
|
Delhi
|
178,180
|
182,336
|
231,269
|
232,376
|
409,449
|
414,712
|
|
Gujarat
|
208,389
|
211,740
|
455,641
|
463,517
|
664,030
|
675,257
|
|
Haryana
|
98,694
|
100,633
|
243,166
|
250,180
|
341,860
|
350,813
|
|
Himachal Pradesh
|
19,009
|
19,516
|
81,751
|
83,309
|
100,760
|
102,825
|
|
Jammu & Kashmir
|
71,441
|
70,320
|
184,530
|
187,382
|
255,971
|
257,702
|
|
Karnataka
|
308,525
|
306,470
|
431,309
|
441,506
|
739,834
|
747,976
|
|
Kerala
|
69,684
|
70,004
|
197,432
|
202,215
|
267,116
|
272,219
|
|
Kolkata
|
100,899
|
103,262
|
166,225
|
168,435
|
267,124
|
271,697
|
|
Madhya Pradesh
|
171,363
|
170,394
|
591,069
|
606,512
|
762,432
|
776,906
|
|
Maharashtra
|
318,056
|
321,413
|
641,525
|
655,979
|
959,581
|
977,392
|
|
Mumbai
|
116,019
|
118,663
|
111,399
|
112,914
|
227,418
|
231,577
|
|
North East
|
41,719
|
41,790
|
92,735
|
95,428
|
134,454
|
137,218
|
|
Odisha
|
86,390
|
87,465
|
320,411
|
329,964
|
406,801
|
417,429
|
|
Punjab
|
180,691
|
181,803
|
514,395
|
523,527
|
695,086
|
705,330
|
|
Rajasthan
|
224,359
|
225,697
|
486,259
|
499,499
|
710,618
|
725,196
|
|
Tamil Nadu
|
428,203
|
424,480
|
400,354
|
410,423
|
828,557
|
834,903
|
|
Uttar Pradesh (East)
|
239,283
|
242,487
|
726,334
|
744,333
|
965,617
|
986,820
|
|
Uttar Pradesh (West)
|
174,395
|
177,497
|
560,565
|
576,731
|
734,960
|
754,228
|
|
West Bengal
|
103,608
|
103,055
|
490,616
|
506,825
|
594,224
|
609,880
|
|
TOTAL
|
3,737,658
|
3,756,489
|
8,584,110
|
8,793,750
|
12,321,768
|
12,550,239
|
|
Net Addition
|
|
18,831
|
|
209,640
|
|
228,471
|
|
Monthly Growth %
|
|
0.50%
|
|
2.44%
|
|
1.85%
|
Annexure-VI
Fixed-Wireless (UBR) Subscribers Base
|
UBR- Fixed Wireless Subscribers
|
|
TSPs Name →
|
Reliance Jio*
|
|
↓Telecom Service Area
|
Mar-26
|
Apr-26
|
|
Andhra Pradesh
|
353,145
|
375,158
|
|
Assam
|
35,934
|
38,202
|
|
Bihar
|
292,063
|
305,328
|
|
Delhi
|
299,206
|
316,296
|
|
Gujarat
|
293,618
|
309,296
|
|
Haryana
|
187,139
|
194,483
|
|
Himachal Pradesh
|
11,072
|
11,824
|
|
Jammu & Kashmir
|
79,862
|
82,200
|
|
Karnataka
|
265,531
|
281,463
|
|
Kerala
|
10,331
|
10,832
|
|
Kolkata
|
193,683
|
205,687
|
|
Madhya Pradesh
|
253,607
|
267,333
|
|
Maharashtra
|
353,187
|
371,633
|
|
Mumbai
|
61,722
|
65,148
|
|
North East
|
15,222
|
16,503
|
|
Odisha
|
57,163
|
60,712
|
|
Punjab
|
250,624
|
263,452
|
|
Rajasthan
|
299,821
|
312,965
|
|
Tamil Nadu
|
183,779
|
195,300
|
|
Uttar Pradesh (East)
|
290,342
|
302,014
|
|
Uttar Pradesh (West)
|
368,895
|
384,717
|
|
West Bengal
|
129,649
|
134,509
|
|
TOTAL
|
4,285,595
|
4,505,055
|
|
Net Addition
|
|
219,460
|
|
Monthly Growth %
|
|
5.12%
|
*Only Reliance Jio Infocomm Limited has reported the information on the number of UBR FWA subscribers.
****
NJ/ARJ
(रिलीज़ आईडी: 2265617)
|