Ministry of Statistics & Programme Implementation
First Revised Estimates of National Income, Consumption Expenditure, Saving and Capital Formation, 2020-21
प्रविष्टि तिथि:
31 JAN 2022 5:30PM by PIB Delhi
The National Statistical Office (NSO), Ministry of Statistics and Programme Implementation is, in this press note, releasing the (i) First Revised Estimates of National Income, Consumption Expenditure, Saving and Capital Formation for the financial year 2020-21 along with (ii) Second Revised Estimates for the financial year 2019-20 and (iii) Third Revised Estimates for the financial year 2018-19 (with Base Year 2011-12) as per the revision policy* of national accounts. Earlier estimates for 2011-12 to 2019-20 were released vide Press Note dated 29th January, 2021 and Provisional Estimates of financial year 2020-21 were released on 31st May, 2021.
2. The First Revised Estimates for the year 2020-21 have been compiled using industry-wise/institution-wise detailed information instead of using the benchmark-indicator method employed at the time of release of Provisional Estimates on 31st May, 2021. The estimates of GDP and other aggregates for the years 2018-19 and 2019-20 have also undergone revisions on account of use of latest available datasets on agricultural production; industrial production (final results of ASI: 2018-19); government data as available in budget documents (replacing Revised Estimates with actuals for the year 2019-20); comprehensive data available from various source agencies like Ministry of Corporate Affairs (MCA), Reserve Bank of India (RBI), National Bank for Agriculture and Rural Development (NABARD) etc. and additional data from State/UT Directorates of Economics and Statistics (DES).
3. The salient features of the revised estimates at aggregate level are given in the paras that follow.
Gross Domestic Product
4. Nominal GDP or GDP at current prices for the year 2020-21 is estimated at ₹198.01 lakh crore as against ₹200.75 lakh crore for the year 2019-20, showing a contraction of 1.4 per cent during 2020-21 as compared to growth of 6.2 per cent during 2019-20.
5. Real GDP or GDP at constant (2011-12) prices for the years 2020-21 and 2019-20 stands at ₹135.58 lakh crore and ₹145.16 lakh crore, respectively, showing a contraction of 6.6 per cent during 2020-21 as compared to growth of 3.7 per cent during 2019-20.
GVA and its Industry-wise Analysis
6. At the aggregate level, nominal GVA at basic prices has declined by 1.6 per cent during 2020-21 against the growth of 6.9 per cent during 2019-20. In terms of real GVA, i.e., GVA at constant (2011-12) basic prices, there has been a contraction of 4.8 per cent in 2020-21, as against growth of 3.8 per cent in 2019-20.
7. The shares of broad sectors of the economy in terms of overall GVA during 2011-12 to 2020-21 and the annual growth rates are mentioned below:
|
Year
|
Sector-wise share in GVA at current prices (in %)
|
Sector-wise growth in GVA at constant (2011-12) prices (in %)
|
Aggregate GVA
(₹ in lakh crore)
|
|
Primary
|
Secondary
|
Tertiary
|
Primary
|
Secondary
|
Tertiary
|
All
|
Current
|
Constant
|
|
2011-12
|
21.7
|
29.3
|
49.0
|
|
|
|
|
81.1
|
81.1
|
|
2012-13
|
21.3
|
28.7
|
50.0
|
1.4
|
3.6
|
8.3
|
5.4
|
92.0
|
85.5
|
|
2013-14
|
21.4
|
27.9
|
50.6
|
4.8
|
4.2
|
7.7
|
6.1
|
103.6
|
90.6
|
|
2014-15
|
20.9
|
27.3
|
51.8
|
1.2
|
6.7
|
9.8
|
7.2
|
115.0
|
97.1
|
|
2015-16
|
20.1
|
27.6
|
52.3
|
2.1
|
9.5
|
9.4
|
8.0
|
125.7
|
104.9
|
|
2016-17
|
20.4
|
27.0
|
52.6
|
7.3
|
7.5
|
8.5
|
8.0
|
139.7
|
113.3
|
|
2017-18
|
20.4
|
27.0
|
52.5
|
4.5
|
7.1
|
6.3
|
6.2
|
155.1
|
120.3
|
|
2018-19*
|
19.8
|
26.9
|
53.3
|
1.6
|
5.9
|
7.2
|
5.8
|
171.8
|
127.3
|
|
2019-20#
|
20.2
|
24.9
|
54.8
|
4.5
|
-1.4
|
6.3
|
3.8
|
183.6
|
132.2
|
|
2020-21@
|
21.8
|
25.1
|
53.1
|
1.6
|
-2.8
|
-7.8
|
-4.8
|
180.6
|
125.9
|
*: Third Revised Estimates; # : Second Revised Estimates; @ : First Revised Estimates
8. The growth rates of Primary sector (comprising Agriculture, Forestry, Fishing and Mining & Quarrying), Secondary sector (comprising Manufacturing, Electricity, Gas, Water Supply & Other Utility Services, and Construction) and Tertiary sector (Services) have been estimated as 1.6 per cent, -2.8 per cent and -7.8 in 2020-21 as against a growth of 4.5 per cent, -1.4 per cent and 6.3 per cent, respectively, in the previous year. The contraction in real GVA during 2020-21 is on account of contraction in ‘Mining and Quarrying’, ‘Manufacturing’, ‘Electricity, Gas, Water Supply & Other Utility Services’, ‘Construction’, ‘Trade, repair, Hotels and Restaurants’, ‘Transport’ and ‘Other services’ as may be seen from Statement 4.2. However, ‘Agriculture, Forestry and Fishing’, ‘Communication & Services related to Broadcasting’, ‘Financial Services’, ‘Real Estate, Ownership of Dwelling & Professional Services’ and ‘Public Administration and Defence’ have witnessed modest growth during this period.
Net National Income
9. Nominal Net National Income (NNI) or NNI at current prices for the year 2020-21 stands at ₹171.94 lakh crore as against ₹177.17 lakh crore in 2019-20, showing a contraction of 2.9 per cent during 2020-21 as against growth of 6.0 per cent in the previous year.
Gross National Disposable Income
10. Gross National Disposable Income (GNDI) at current prices is estimated at ₹200.86 lakh crore for the year 2020-21, while the estimate for the year 2019-20 stands at ₹204.22 lakh crore, showing a contraction of 1.6 per cent for year 2020-21 as against growth of 6.4 per cent in the year 2019-20.
Saving
11. Gross Saving during 2020-21 is estimated at ₹55.92 lakh crore against ₹59.96 lakh crore during 2019-20. Share of Non-financial corporations, Financial corporations, General Government and Household sectors in Gross Savings during 2020-21 stands at 35.6%, 10.0%, (-) 24.1% and 78.5% respectively. Rate of Gross Saving to GNDI for 2020-21 is estimated at 27.8 per cent as against 29.4 per cent for 2019-20.
Capital Formation
12. Gross Capital Formation (GCF) at current prices is estimated at ₹54.03 lakh crore for the year 2020-21 as compared to ₹61.61 lakh crore during 2019-20. The rate of GCF to GDP is 27.3 per cent during 2020-21 as against 30.7 per cent in the 2019-20. The rates of capital formation in the years 2011-12 to 2019-20 have been higher than the rate of saving because of positive net capital flow from RoW. The rate of GCF to GDP at constant (2011-12) prices was 34.1 per cent in 2019-20 and 31.5 per cent in 2020-21.
13. In terms of the share to the total GFCF (at current prices), the highest contributor is Non-Financial Corporations followed by Household sector, share of which stood at 43.9 % and 38.9 % respectively in 2020-21.
Consumption Expenditure
14. Private Final Consumption Expenditure (PFCE) at current prices is estimated at ₹120.33 lakh crore for the year 2020-21 as against ₹122.37 lakh crore in 2019-20. In relation to GDP, the rates of PFCE to GDP at current prices during 2019-20 and 2020-21 are 61.0 per cent and 60.8 per cent respectively. At constant (2011-12) prices, the PFCE is estimated at ₹82.60 lakh crore and ₹77.64 lakh crore, respectively, for the years 2019-20 and 2020-21. The corresponding rates of PFCE to GDP for the years 2019-20 and 2020-21 are 56.9 per cent and 57.3 per cent respectively.
15. Government Final Consumption Expenditure (GFCE) at current prices is estimated at ₹23.93 lakh crore for the year 2020-21 as against ₹22.01 lakh crore during 2019-20. At constant (2011-12) prices the estimates of GFCE for the years 2019-20 and 2020-21 stand at ₹14.84 lakh crore and ₹15.38 lakh crore respectively.
Per Capita Estimates
16. Per Capita Income i.e. Per Capita Net National Income at current prices is estimated at ₹1,32,115 and ₹1,26,855 respectively for the years 2019-20 and 2020-21. Per Capita PFCE at current prices for the years 2019-20 and 2020-21 is estimated at ₹91,254 and ₹88,775 respectively.
Summary of Revisions in the GDP Estimates
Revision in the estimates of the year 2020-21
17. The following statement gives the major reasons of variation between the Provisional Estimates (released on 31st May, 2021) and the First Revised Estimates of GVA for 2020-21.
|
Sector
|
GVA growth in 2020-21
(at 2011-12 Prices)
|
Major reasons for variation
|
|
Prov. Estimate (PE),
May 2021
|
First Revised Estimate (FRE),
Jan 2022
|
|
Primary[i]
|
1.9
|
1.6
|
GVA estimates of Agriculture, Forestry and Fishing sectors have undergone revision due to revision in production estimates of crop sector as per 4th Advance estimate of Ministry of Agriculture and Farmers welfare. Also, for horticulture sector, 3rd Advance estimates of production have been used. The revision in other industries in Primary Sector is due to the incorporation of latest revised data.
|
|
Secondary[ii]
|
-6.8
|
-2.8
|
Estimates of secondary sector have undergone upward revision due to availability of additional data in respect of companies post PE FY 2020-21 release and revision in input data by source agencies. At the time of compilation of PE, major input data was sourced from IIP besides financial results of limited number of listed companies particularly for Q4 2020-21.
|
|
Tertiary[iii]
|
-8.4
|
-7.8
|
Estimates of tertiary sector have undergone revision due to the use of Revised Estimates (RE) from Central & State budget documents instead of Budget Estimates (BE). However, the information on Actual Expenditure of various Ministries/Departments of Central Government for 2020-21 has been used to the extent available on PFMS. Also, a larger number of public & private sector companies were analyzed in compilation of revised estimates.
|
|
Total GVA at Basic Prices
|
-6.2
|
-4.8
|
|
|
GDP
|
-7.3
|
-6.6
|
|
Reason(s) for revisions in the estimates of the years 2018-19 and 2019-20
18. The use of latest available data from various agencies has resulted in some changes in both the levels of GVA and growth estimates for the years 2018-19 and 2019-20.
Revisions in Major Aggregates
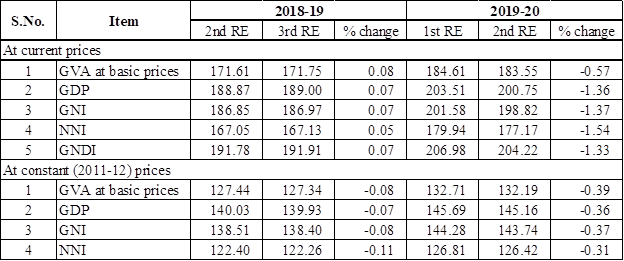
19. The level of revisions in the major aggregates at current and constant (2011-12) prices are given in the following table:
Major National Income Aggregates and their % Changes
(₹ in Lakh Crore)
Major reasons for revisions in GVA/GDP estimates are as given below:
Year 2018-19
- Use of updated estimates of production and prices of some crops, livestock products, fish and forestry products from few States & DESs.
- Use of final results of ASI: 2018-19 in place of provisional results.
- Use of latest survey result of All India Debt & Investment Survey and analysis of latest reports of few NBFIs/ financial auxiliaries
- Use of updated information received from state governments and local bodies.
Year 2019-20
- Use of updated estimates of production and prices of some crops, livestock products, fish and forestry products from a few states and DESs.
- Use of augmented data for non-financial private corporate sector.
- Use of ‘Actuals’ in place of “Revised Estimates” of different items of expenditure and receipts in the Central & State government budgets.
- Use of updated information on Local Bodies & Autonomous Institutions.
- Use of latest annual reports of Public Sector Enterprises.
- Use of latest data received for Cooperative Banks, Postal Life Insurance (PLI) & Post Office Saving Bank (POSB), Non-Banking Financial Institutions (NBFIs), Employee Provident Fund Organisation (EPFO) and Financial Auxiliaries.
Detailed statements
20. List of Statements released in this press note is given below. More details of the revised estimates, i.e., FRE 2020-21, SRE 2019-20 and TRE 2018-19 are available in Statements 1 to 9 appended to this Press Note.
- Statement 1.1: Key Aggregates of National Accounts at Current Prices
- Statement 1.2: Key Aggregates of National Accounts at Constant (2011-12) Prices
- Statement 2: Per Capita Income, Product and Final Consumption
- Statement 3.1: Output by Economic Activity and Capital Formation by Industry of
Use at Current Prices
- Statement 3.2: Output by Economic Activity and Capital Formation by Industry of
Use at Constant (2011-12) Prices
- Statement 4.1: Gross Value Added by Economic Activity at Current Basic Prices
- Statement 4.2: Gross Value Added by Economic Activity at Constant (2011-12)
Basic Prices
- Statement 5: Finances for Gross Capital Formation
- Statement 6.1: Gross Capital Formation by Industry of Use at Current Prices
- Statement 6.2: Gross Capital Formation by Industry of Use at Constant (2011-12)
Prices
- Statement 7.1: Gross Fixed Capital Formation by Asset & Institutional Sector at
Current Prices
- Statement 7.2: Gross Fixed Capital Formation by Asset & Institutional Sector at
Constant (2011-12) Prices
- Statement 8.1: Private Final Consumption Expenditure at Current Prices
- Statement 8.2: Private Final Consumption Expenditure at Constant (2011-12) Prices
- Statement 9: Institutional Sectors – Key Economic Indicators at Current Prices
Upcoming Releases
21. The upcoming releases on GDP are indicated below:
- Second Advance Estimates for the year 2021-22, along with quarterly estimates for Q1 (April-June), Q2 (July-September) and Q3 (October-December) of 2021-22 on 28th February, 2022; and,
- Provisional Estimates for the year 2021-22, along with estimates for all the four quarters of the financial year 2021-22 on 31st May, 2022.
*******************************
Annexure
FORMULAE
- GVA at basic prices (Production Approach) = Output at basic price – Intermediate Consumption
- GVA at basic prices (Income Approach) = CE + OS/MI + CFC + Production taxes less Production subsidies(i)
- GDP = ∑ GVA at basic prices + Product taxes less Product subsidies(ii)
- NDP/NNI = GDP/GNI - CFC
- GNI = GDP + Net primary income from ROW (Receipts less payments)
- Primary Incomes = CE + Property and Entrepreneurial Income
- NNDI =NNI + other current transfers(iii) from ROW, net (Receipts less payments)
- GNDI = NNDI + CFC = GNI + other current transfers(iii) from ROW, net (Receipts less payments)
- Gross Capital Formation(iv) (Financing Side) = Gross Savings + Net Capital Inflow from ROW
- GCF (Expenditure Side) = GFCF + CIS + Valuables
- Gross Disposable Income of Govt. = GFCE + Gross Saving of General Government
- Gross Disposable Income (GDI) of Households = GNDI – GDI of Govt. – Gross Savings of All Corporations
REMARKS ON THE FORMULAE
- Production taxes or subsidies are paid or received with relation to production and are independent of the volume of actual production. Some examples are:
Production Taxes - Land Revenues, Stamps & Registration fees and Tax on profession
Production Subsidies - Subsidies to Railways, Subsidies to village and small industries.
- Product taxes or subsidies are paid or received on per unit of product. Some examples are:
Product Taxes- Excise duties, Sales tax, Service Tax and Import, Export duties
Product Subsidies- Food, Petroleum and fertilizer subsidies.
- Other Current Transfers refers to current transfers other than the primary incomes.
- Gross Capital Formation (GCF) at the current as well as the constant prices is estimated by two approaches: – (i) through flow of funds, derived as Gross Saving plus net capital flow from Rest of the World (RoW); and (ii) by the commodity flow approach, derived by the type of assets. The estimates of GCF through the flow of funds approach are treated as the firmer estimates. GCF by industry of use and by institutional sectors does not include ‘valuables’ and therefore, these estimates are lower than the estimates available from commodity flow approach.
Click here to see press note
******
DS/VJ
* Available on www.mospi.gov.in
Formulae for various aggregates mentioned in the press note are given in Annexure.
[i] Primary sector comprises agriculture, forestry, fishing and mining & quarrying activities.
[ii] Secondary sector comprises manufacturing; electricity, gas, water supply & other utility services and construction
[iii] Tertiary sector comprises all services.
(रिलीज़ आईडी: 1793861)
आगंतुक पटल : 10421