|
Ministry of Communications
“Indian Telecom Services Performance Indicator Report” for the Quarter January-March, 2025
प्रविष्टि तिथि:
19 JUN 2025 4:54PM by PIB Delhi
TRAI today has released the “Indian Telecom Services Performance Indicator Report” for the Quarter ending 31st March, 2025. This Report provides a broad perspective of the Telecom Services in India and presents the key parameters and growth trends of the Telecom Services as well as Cable TV, DTH & Radio Broadcasting services in India for the period covering 1st January, 2025 to 31st March, 2025 compiled mainly on the basis of information furnished by the Service Providers.
Executive Summary of the Report is enclosed. The complete Report is available on TRAI’s website (www.trai.gov.in and under the link http://www. trai.gov.in/release-publication/reports/performance-indicators-reports). Any suggestion or any clarification pertaining to this report, Shri Vijay Kumar, Advisor (F&EA), TRAI may be contacted on Tel. +91-20907773 and e-mail: advfea1@trai.gov.in.
The Indian Telecom Services Performance Indicators
January–March, 2025
Executive Summary
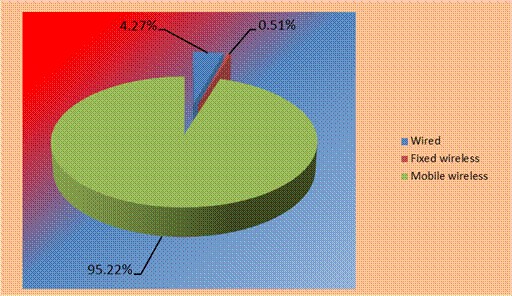
- Total number of Internet subscribers decreased from 970.16 million at the end of Dec-24 to 969.10 million at the end of Mar-25, registering a quarterly rate of decline 0.11%. Out of 969.10 million internet subscribers, number of Wired Internet subscribers are 41.41 million and number of Wireless Internet subscribers are 927.70 million.
Composition of internet subscription
- The Internet subscriber base is comprised of Broadband Internet subscriber base of 944.12 million and Narrowband Internet subscriber base of 24.98 million.
- The broadband Internet subscriber base decreased by 0.09% from 944.96 million at the end of Dec-24 to 944.12 million at the end of Mar-25. The narrowband Internet subscriber base decreased from 25.20 million at the end of Dec-24 to 24.98 million at the end of Mar-25.
- Wireline subscribers decreased from 39.27 million at the end of Dec-24 to 37.04 million at the end of Mar-25 with a quarterly rate of decline 5.67%. This decrease is due to the accounting of 5G FWA subscribers in wireless category. On Y-O-Y basis, wireline subscriptions increased by 9.62% at the end of QE Mar-25.
- Wireline Tele-density decreased from 2.79% at the end of Dec-24 to 2.62% at the end of Mar-25 with quarterly rate of decline 5.88%.
- Monthly Average Revenue per User (ARPU) for wireless service increased by 0.64%, from Rs.181.80 in QE Dec-24 to Rs.182.95 in QE Mar-25. On Y-O-Y basis, monthly ARPU for wireless service increased by 19.16% in this quarter.
- The ARPU per month for the pre-paid segment is Rs.182.53 and the ARPU per month for the post-paid segment is Rs.187.48 for Q.E. Mar-2025.
- On an all-India average, the overall MOU per month Increased by 1.64% from 1009 in Q.E. Dec 2024 to 1026 in Q.E. Mar 2025.
- Prepaid MOU per subscriber is 1074 and Postpaid MOU per subscriber per month is 514 in QE Mar-25.
- Gross Revenue (GR), Applicable Gross Revenue (ApGR) and Adjusted Gross Revenue (AGR) of Telecom Service Sector for the Q.E. Mar-25 has been Rs.98,250 Crore, Rs.92,618 crore and Rs.79,226 Crore respectively. GR increased by 1.93%, ApGR increased by 0.30% and AGR increased by 1.66% in Q.E. Mar-25, as compared to previous quarter.
- The Y-O-Y rate of growth in GR, ApGR and AGR in Q.E. Mar-25 over the same quarter in last year has been 11.74%, 10.33% and 12.44% respectively.
- Pass Through Charges decreased from Rs.14,410 Crore in QE Dec-24 to Rs.12,982 Crore in QE Mar-25 with quarterly rate of decline by 9.91%. The Y-O-Y rate of decline 3.71% has been recorded in pass-through charges for QE Mar-25.
- The License Fee increased from Rs.6,234 Crore for the QE Dec-24 to Rs.6,340 Crore for the QE Mar-25. The quarterly and the Y-O-Y rates of growth in license fees are 1.69% and 12.46% respectively in this quarter.
Service-wise composition of Adjusted Gross Revenue
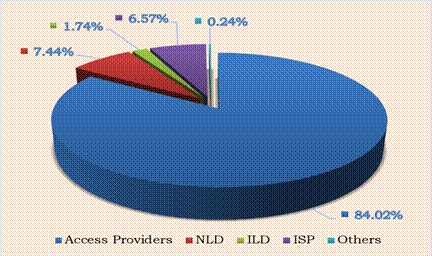
- Access services contributed 84.02% of the total Adjusted Gross Revenue of telecom services. In Access services, Gross Revenue (GR), Applicable Gross Revenue (ApGR), Adjusted Gross Revenue (AGR), License Fee, Spectrum Usage Charges (SUC) and Pass Through Charges increased by 2.16%, 0.85%, 1.25%, 1.29%, 1.16% and -1.03% respectively in QE Mar-25.
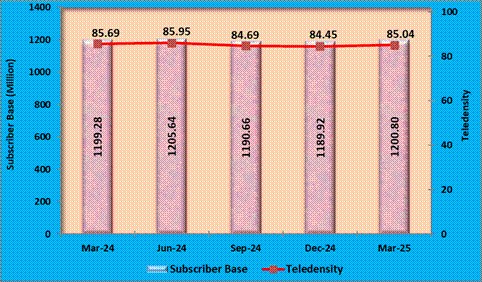
- The number of total telephone subscribers in India increased from 1,189.92 million at the end of Dec-24 to 1,200.80 million at the end of Mar-25, registering a rate of growth 0.91% over the previous quarter. This reflects Year-On-Year (Y-O-Y) rate of growth 0.13% over the same quarter of the last year. The overall Tele-density in India increased from 84.45% as in QE Dec-24 to 85.04% as in QE Mar-25.
Trends in Telephone subscribers and Tele-density in India
- Telephone subscribers in Urban areas increased from 662.72 million at the end of Dec-24 to 666.11 million at the end of Mar-25 and Urban Tele-density also increased from 131.37% to 131.45% during the same period.
- Rural telephone subscribers increased from 527.20 million at the end of Dec-24 to 534.69 million at the end of Mar-25 and Rural Tele-density also increased from 58.29% to 59.06% during the same period.
- Out of the total subscription, the share of Rural subscription increased from 44.31% at the end of Dec-24 to 44.53% at the end of Mar-25.
Composition of Telephone Subscribers
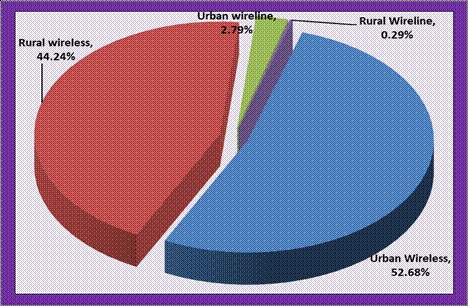
- With a net addition of 13.10 million subscribers during the quarter, the total wireless (mobile+5G FWA) subscriber base increased from 1150.66 million (Mobile) at the end of Dec-24 to 1163.76 million (mobile+5G FWA) at the end of Mar-25, registering a rate of growth 1.14% over the previous quarter. On Y-O-Y basis, wireless (mobile+5G FWA) subscriptions decreased at the rate of 0.15% during the year.
- Wireless Tele-density increased from 81.67% (mobile) at the end of Dec-24 to 82.42% (mobile+5G FWA) at the end of Mar-25 with quarterly rate of growth of 0.92%.
- With a net addition of 6.33 million subscribers during the quarter, the wireless (mobile) subscriber base increased from 1150.66 million at the end of Dec-24 to 1156.99 million at the end of Mar-25, registering a rate of growth 0.55% over the previous quarter. On Y-O-Y basis, wireless (mobile) subscriptions decreased at the rate of 0.73% during the year.
- Wireless (mobile) Tele-density increased from 81.67% at the end of Dec-24 to 81.94% at the end of Mar-25 with quarterly rate of growth of 0.33%.
- During this quarter, the following parameters in terms of QoS benchmarks have been fully complied with by wireline service providers in all the LSAs: -
|
S. No.
|
Parameter
|
Benchmark
|
|
1
|
Point of Interconnection (POI) Congestion (90th percentile value)
|
≤ 0.5%
|
|
2
|
Accessibility of call centre/ customer care
|
≥ 95%
|
|
3
|
Percentage of calls answered by the operators (voice to voice) within 90 seconds
|
≥ 95%
|
|
4
|
Termination/ closure of service within seven working days of receipt of customer’s request
|
100%
|
- During this quarter, list of QoS parameters which are fully complied with by all the Access Service (Wireless) providers in all the LSAs: -
|
S No.
|
Parameter
|
Benchmark
|
|
1
|
Cumulative downtime (Cells not available for service)
|
≤ 2%
|
|
2
|
Percentage of significant network outage (services not available in a district for more than 4 hours) reported to the Authority within 24 hrs of start of the outage
|
100%
|
|
3
|
Call Set-up Success Rate: Intra- Service provider (within service provider’s network)
|
≥ 98%
|
|
4
|
Call Set-up Success Rate: Inter- Service provider (incoming from other service providers’ network)
|
≥ 95%
|
|
5
|
Point of Interconnection (POI) Congestion (90th percentile value)
|
≤ 0.5%
|
|
6
|
DCR Spatial Distribution Measure for Circuit Switched (2G/3G) network [CS_QSD (88, 88)]
|
≤ 2%
|
|
7
|
Downlink Packet Drop Rate for Packet Switched Network (4G/5G and beyond) [DLPDR_QSD (88, 88)]
|
≤ 2%
|
|
8
|
Latency (in 4G and 5G network)
|
≤ 75 msec
|
|
9
|
Packet Drop Rate (in 4G and 5G network)
|
≤ 3%
|
|
10
|
Billing and charging complaints
|
≤ 0.1%
|
|
11
|
Application of adjustment to customer’s account within one week from the date of resolution of billing and charging complaints or rectification of faults or rectification of significant network outage, as applicable
|
100%
|
|
12
|
Termination/ closure of service within seven working days of receipt of customer’s request
|
100%
|
|
13
|
Refund of deposits within 45 days of closure of service or non-provisioning of service
|
100%
|
- List of QoS parameters which are fully complied with by all the Broadband (Wireline) Service providers in all the service areas: -
|
S. No.
|
Parameter
|
Benchmark
|
|
1
|
Latency
|
<=50msec
|
|
2
|
Packet Drop Rate
|
<=1%
|
|
3
|
Maximum Bandwidth utilization of any Customer serving node to ISP Gateway Node [Intra-network] or Internet Exchange Point Link(s)
|
<=80%
|
|
4
|
Jitter
|
≤ 40ms
|
|
5
|
Accessibility of call centre/ customer care
|
≥ 95%
|
- A total of approximately 918 private satellite TV channels have been permitted by the Ministry of Information and Broadcasting (MIB) for uplinking only/downlinking only/both uplinking & downlinking.
- As per the reporting done by broadcasters in pursuance of the Tariff Order dated 3rd March 2017, as amended, out of 908 permitted satellite TV channels which are available for downlinking in India, there are 333 satellite pay TV channels as on 31st March, 2025. Out of 333 pay channels, 232 are SD satellite pay TV channels and 101 are HD satellite pay TV channels.
- During the QE 31st March 2025, there were 4 pay DTH service providers in the country.
- Pay DTH has attained total active subscriber base of around 56.92 million. This is in addition to the subscribers of the DD Free Dish (free DTH services of Doordarshan). The total active subscriber base has decreased from 58.22 million in December 2024 to 56.92 million in March 2025.
- Apart from the radio channels operated by All India Radio – the public broadcaster, as per the data reported by FM Radio operators to TRAI, as on 31st December 2024, there were 388 operational private FM Radio channels in 113 cities operated by 36 private FM Radio operators. During the quarter ending 31st March 2025, six channels operated by three private FM radio operators, namely, (i) Digital Radio (Delhi) Broadcasting Ltd (3 channels), (ii) Digital Radio (Mumbai) Broadcasting Ltd (2 channels), and (iii) Digital Radio (Kolkata) Broadcasting Ltd (1 channel), were merged with South Asia FM Ltd. Now, as of 31st March 2025, there are 388 operational private FM radio channels across 113 cities, operated by 33 private FM radio operators.
- The advertisement revenue reported by FM Radio operators during the quarter ending 31st March 2025 in respect of 388 private FM Radio channels is Rs.466.63 crore as against Rs.500.11 crore in respect of 388 private FM Radio channels for the previous quarter.
- As on 31st March, 2024, 531 Community Radio stations are operational.
SNAPSHOT
|
(Data as on Q.E. 31st March, 2025)
|
|
Telecom Subscribers (Wireless+Wireline)
|
|
Total Subscribers
|
1200.80 Million
|
|
% change over the previous quarter
|
0.91%
|
|
Urban Subscribers
|
666.11 Million
|
|
Rural Subscribers
|
534.69 Million
|
|
Market share of Private Operators
|
91.47%
|
|
Market share of PSU Operators
|
8.53%
|
|
Tele-density
|
85.04%
|
|
Urban Tele-density
|
131.45%
|
|
Rural Tele-density
|
59.06%
|
|
Wireless (Mobile+5G FWA) Subscribers
|
|
Wireless (Mobile) Subscribers
|
1,156.99 Million
|
|
Wireless (5G FWA) Subscribers
|
6.77 Million
|
|
Total Wireless Subscribers
|
1,163.76 Million
|
|
% change over the previous quarter
|
1.14%
|
|
Urban Subscribers
|
632.57 Million
|
|
Rural Subscribers
|
531.18 Million
|
|
Market share of Private Operators
|
92.09%
|
|
Market share of PSU Operators
|
7.91%
|
|
Tele-density
|
82.42%
|
|
Urban Tele-density
|
124.83%
|
|
Rural Tele-density
|
58.67%
|
|
Total Wireless Data Usage during the quarter
|
59,447 PB
|
|
Number of Public Mobile Radio Trunk Services (PMRTS)
|
67,023
|
|
Number of Very Small Aperture Terminals (VSAT)
|
2,43,663
|
|
Wireline Subscribers
|
|
Total Wireline Subscribers
|
37.04 Million
|
|
% change over the previous quarter
|
-5.67%*
|
|
Urban Subscribers
|
33.54 Million
|
|
Rural Subscribers
|
3.50 Million
|
|
Market share of PSU Operators
|
27.87%
|
|
Market share of Private Operators
|
72.13%
|
|
Tele-density
|
2.62%
|
|
Rural Tele-density
|
0.39%
|
|
Urban Tele-density
|
6.62%
|
|
No. of Public Call Office (PCO)
|
10,185
|
*Due to accounting of 5G-FWA subscribers in wireless category.
|
Telecom Financial Data
|
|
Gross Revenue (GR) during the quarter
|
Rs. 98,250/- crore
|
|
% change in GR over the previous quarter
|
1.93%
|
|
Applicable Gross Revenue (ApGR) during quarter
|
Rs. 92,618/- crore
|
|
% change in ApGR over the previous quarter
|
0.30%
|
|
Adjusted Gross Revenue (AGR) during the quarter
|
Rs.79,226/- crore
|
|
% change in AGR over the previous quarter
|
1.66%
|
|
Share of Public sector undertakings in Access AGR
|
3.59%
|
|
Internet/Broadband Subscribers
|
|
Total Internet Subscribers
|
969.10 Million
|
|
% change over previous quarter
|
-0.11%
|
|
Narrowband subscribers
|
24.98 Million
|
|
Broadband subscribers
|
944.12 Million
|
|
Wired Internet Subscribers
|
41.41 Million
|
|
Wireless Internet Subscribers
|
927.70 Million
|
|
Urban Internet Subscribers
|
561.42 Million
|
|
Rural Internet Subscribers
|
407.69 Million
M
|
|
Total Internet Subscribers per 100 population
|
68.63
|
|
Urban Internet Subscribers per 100 population
|
110.79
|
|
Rural Internet Subscribers per 100 population
|
45.03
|
|
Total Outgoing Minutes of Usage for Internet Telephony
|
70.90 Million
|
|
No. of Public Wi-Fi Hotspots
|
55,052
|
|
Aggregate Data Consumed (TB) for Wi-Fi Hotspots
|
14,329
|
|
Broadcasting & Cable Services
|
|
Number of private satellite TV channels permitted by the Ministry of I&B for uplinking only/downlinking only/both uplinking and downlinking
|
918
|
|
Number of Pay TV Channels as reported by broadcasters
|
333
|
|
Number of private FM Radio Stations (excluding All India Radio)
|
388
|
|
Number of total active subscribers with pay DTH operators
|
56.92 Million
|
|
Number of Operational Community Radio Stations
|
531
|
|
Number of pay DTH Operators
|
4
|
|
Revenue & Usage Parameters
|
|
Monthly ARPU of Wireless Service
|
Rs.182.95
|
|
Minutes of Usage (MOU) per subscriber per month - Wireless Service
|
1026
|
|
Wireless Data Usage
|
|
Average Wireless Data Usage per wireless data subscriber per month
|
22.19 GB
|
|
Average revenue realization per GB for wireless data usage during the quarter
|
Rs.9.11
|
****
Samrat/Allen
(रिलीज़ आईडी: 2137690)
|