Ministry of Statistics & Programme Implementation
Household Consumption Expenditure Survey: 2022-23 & 2023-24
Nutritional Intake in India
प्रविष्टि तिथि:
02 JUL 2025 4:54PM by PIB Delhi
INTRODUCTION
The back-to-back Household Consumption Expenditure Surveys (HCES) conducted during August 2022 – July 2023 and August 2023 – July 2024 collected information on consumption of food items by the members of the households during specified reference periods. Based on the food consumption data and utilizing the nutrient content values of different food items estimates of per day per capita and per day per consumer unit intake of calorie, protein and fat has been generated at various levels of disaggregation, namely, State, sector, fractile classes of Monthly Per Capita Consumption Expenditure (MPCE), etc. These are collated and published in the form of a report entitled ‘Nutritional Intake in India’.
It has been a practice in the National Statistics Office (NSO) to bring out a comprehensive report providing information on nutritional intake by the Indian population with detailed break-up of estimates of per capita intake of energy (Calorie), protein and fat and its distribution over households and persons. Till date, five such reports based on NSS’s 50th round (1993-94), 55th round (1999-2000), 61st round (2004-05), 66th round (2009-10) and 68th round (2011-12) consumer expenditure surveys have been published. Following the tradition and also to meet the requirement of vital information on nutritional intake of different segments of the population for policymakers, researchers, analysts etc. this report is being published.
IMPORTANT FINDINGS:
- A similar pattern in the average per day per capita and per consumer unit calorie intake is observed in rural and urban India in 2022-23 and 2023-24.
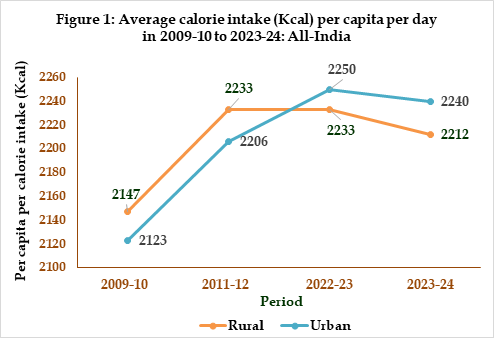
- The average per capita per day calorie intake in rural India was 2233 Kcal and 2212 Kcal in rural India 2022-23 and 2023-24 respectively while the corresponding figures for the two years in urban India were 2250 Kcal and 2240 Kcal respectively.
- An increase in average per capita per day and per consumer unit per day calorie intake is observed for the bottom five fractile classes in rural India and for the bottom six fractile classes for urban in 2023-24 from 2022-23.
- A wide variation both in average per capita per day calorie intake and average per consumer unit per day calorie intake is observed among the major states in 2022-23 as well as in 2023-24.
- With an increase in the Monthly Per Capita Consumption Expenditure (MPCE), the average calorie intake also increases in rural as well as urban India.
I. AVERAGE NUTRIENT INTAKE
The average per capita per day calorie intake and per consumer unit per day calorie intake for all-India across both the periods 2022-23 & 2023-24 is given below in Table 1:
|
Table 1: Average daily per capita and per consumer unit intake of calorie, protein and fat in 2022-23 & 2023-24: All-India
|
|
Intake of
|
per capita per day
|
per consumer unit* per day
|
|
2022-23
|
2023-24
|
2022-23
|
2023-24
|
|
Rural
|
Urban
|
Rural
|
Urban
|
Rural
|
Urban
|
Rural
|
Urban
|
|
Calorie (Kcal)
|
2233
|
2250
|
2212
|
2240
|
2407
|
2488
|
2383
|
2472
|
|
Protein (gm)
|
61.9
|
63.2
|
61.8
|
63.4
|
66.7
|
69.9
|
66.6
|
69.9
|
|
Fat (gm)
|
59.7
|
70.5
|
60.4
|
69.8
|
64.4
|
78.0
|
65.1
|
77.0
|
*Consumer unit is a unit used to measure the energy requirement of a group of persons of different sectors, gender and age-groups
A more or less similar pattern is observed in the daily per capita and per consumer unit intake of calories, protein, and fat in both rural and urban India during both periods.
II. VARIATION IN CALORIE INTAKE WITH LEVEL OF WELL-BEING
The average calorie intake across different fractile classes (formed separately for rural and urban sectors) of the distribution of population by MPCE at all-India level is shown in Table 2. In each sector, the average calorie intake (per capita or per consumer unit) is seen to be improving with an increase in MPCE.
The difference between the bottom fractile class (bottom 5% of population ranked by per capita expenditure level) and the top fractile class (top 5% of population ranked by per capita expenditure level) in per capita calorie intake as well as per consumer unit calorie intake has narrowed significantly in 2023-24 in rural as well as urban India.
|
Table 2: Average calorie intake per capita and per consumer unit by fractile classes of MPCE in 2022-23 & 2023-24: All-India
|
|
Fractile classes of MPCE
|
calorie intake (Kcal) per day per capita
|
calorie intake (Kcal) per day per consumer unit*
|
|
2022-23
|
2023-24
|
2022-23
|
2023-24
|
|
Rural
|
Urban
|
Rural
|
Urban
|
Rural
|
Urban
|
Rural
|
Urban
|
|
(1)
|
(2)
|
(3)
|
(4)
|
(5)
|
(6)
|
(7)
|
(8)
|
(9)
|
|
0-5%
|
1607
|
1623
|
1688
|
1696
|
1796
|
1853
|
1893
|
1924
|
|
5-10%
|
1782
|
1772
|
1834
|
1837
|
1967
|
1999
|
2030
|
2075
|
|
10-20%
|
1896
|
1885
|
1924
|
1946
|
2083
|
2116
|
2113
|
2176
|
|
20-30%
|
2012
|
1981
|
2023
|
2033
|
2196
|
2214
|
2206
|
2262
|
|
30-40%
|
2093
|
2054
|
2096
|
2091
|
2270
|
2279
|
2275
|
2319
|
|
40-50%
|
2169
|
2148
|
2163
|
2159
|
2344
|
2379
|
2336
|
2389
|
|
50-60%
|
2243
|
2226
|
2227
|
2221
|
2415
|
2456
|
2394
|
2448
|
|
60-70%
|
2332
|
2316
|
2289
|
2306
|
2497
|
2549
|
2442
|
2536
|
|
70-80%
|
2425
|
2420
|
2370
|
2402
|
2580
|
2649
|
2518
|
2634
|
|
80-90%
|
2551
|
2620
|
2483
|
2560
|
2700
|
2853
|
2625
|
2789
|
|
90-95%
|
2716
|
2827
|
2619
|
2744
|
2851
|
3073
|
2755
|
2958
|
|
95-100%
|
3116
|
3478
|
2941
|
3092
|
3248
|
3723
|
3069
|
3292
|
|
All-India
|
2233
|
2250
|
2212
|
2240
|
2407
|
2488
|
2383
|
2472
|
*Consumer unit is a unit used to measure the energy requirement of a group of persons of different sectors, gender and age-groups
III. TREND IN AVERAGE NUTRIENT INTAKE
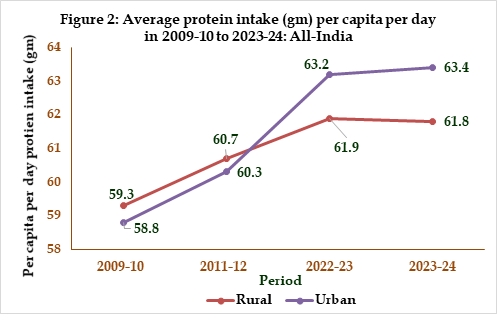
The estimate of average per capita per day calorie and protein intake at all-India level from 2009 – 10 till 2023-24 separately for rural and urban areas are shown in Figures 1 & 2. A marginal increase in the per capita per day intake of calorie is observed from the period 2009-10 to 2023-24 at all-India level in rural and urban areas. A similar increasing trend in per capita per day intake of protein is observed in rural and urban India since 2009-10.
IV. PERCENTAGE BREAK-UP OF PROTEIN INTAKE BY FOOD CATEGORY: ALL-INDIA
The percentage break-up of protein intake over 5 food groups, viz., cereals, pulses, milk & milk products, egg/fish/meat, and other food at all-India level is presented in Figures 4R & 4U for the period 2022-23 & in Figures 5R & 5U for 2023-24, respectively for rural and urban sectors. Cereals continue to be the most important source of protein among the 5 food groups, with a share of about 46-47% for rural India and about 39% for urban India in both the periods.
V. TRENDS IN BREAK-UP OF PROTEIN INTAKE BY FOOD CATEGORY: ALL-INDIA
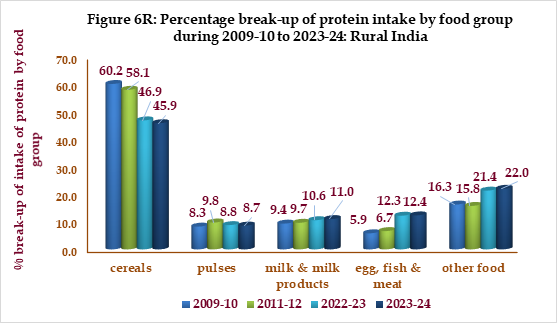
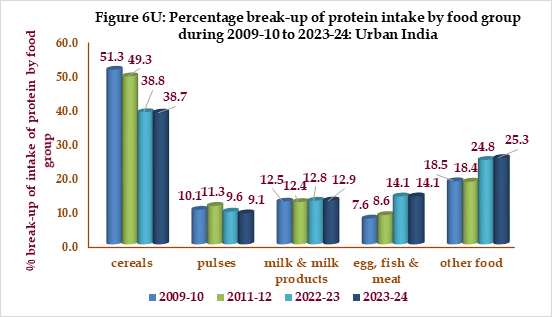
Figures 6R & 6U shows percentage break-up of protein intake by food groups for India as a whole over the period 2009-10 to 2023-24.
The contribution of cereals to protein intake has fallen by about 14% in rural India and nearly 12% in urban India from the level of 2009-10. The fall in the share of cereals has been balanced by significant rises in the share of egg, fish & meat, other food and a marginal increase in the share of milk and milk products across rural and urban India.
VI. ADJUSTED NUTRIENT INTAKE
Consumption of food items by a household includes not only the actual consumption by the members of the household but also the consumption of meals prepared in the household and served to non-household members during the reference period. Further, cooked meals purchased from the market for consumption of the members and for guests are also recorded in the purchaser’s household. Thus, to find out the estimate of nutrient intake level closer to ‘true’ intake of the members of the household, adjustments are made using an appropriate methodology. The estimates of per capita per day adjusted nutrient intake along with unadjusted nutrient intake are shown below in Table 3:
|
Table 3: Average daily per capita adjusted and unadjusted intake of calorie, protein and fat in 2022-23 & 2023-24: All-India
|
|
Intake of
|
per capita per day
|
|
unadjusted
|
adjusted
|
|
2022-23
|
2023-24
|
2022-23
|
2023-24
|
|
Rural
|
Urban
|
Rural
|
Urban
|
Rural
|
Urban
|
Rural
|
Urban
|
|
Calorie (Kcal)
|
2233
|
2250
|
2212
|
2240
|
2210
|
2216
|
2191
|
2225
|
|
Protein (gm)
|
61.9
|
63.2
|
61.8
|
63.4
|
61.3
|
62.4
|
61.2
|
62.9
|
|
Fat (gm)
|
59.7
|
70.5
|
60.4
|
69.8
|
59.1
|
69.6
|
59.7
|
69.3
|
On an average at all-India level the adjusted nutrient figures are marginally lower than those of the unadjusted ones in both the sectors during both HCES: 2022-23 and HCES: 2023-24. A similar pattern is observed for per capita intake of protein and fat across both the sectors.
***
Samrat/Allen
(रिलीज़ आईडी: 2141561)
आगंतुक पटल : 4393