Ministry of Statistics & Programme Implementation
NEW SERIES OF GROSS DOMESTIC PRODUCT (GDP) ESTIMATES WITH BASE YEAR 2022-23
The Ministry of Statistics and Programme Implementation (MoSPI) is releasing the New Series of Annual and Quarterly National Accounts Estimates with base year 2022–23, which replaces the previous series with base year of 2011–12
Posted On:
27 FEB 2026 4:00PM by PIB Delhi
The Ministry of Statistics and Programme Implementation (MoSPI) is releasing the New Series of Annual and Quarterly National Accounts Estimates with base year 2022–23, which replaces the previous series with base year of 2011–12. As per the International best practices, base year revision is undertaken periodically and differs from regular revisions in National Accounts primarily because of nature of changes. In Annual revisions, changes are made only on the basis of updated data becoming available without making any changes in the conceptual framework or using any new data source, to ensure strict comparison over years. In case of base year revisions, changes are made to:
- Capture structural changes in the economy
- Incorporate latest data sources
- Improve estimation methodologies
- Enhance coverage and accuracy
The Financial Year (FY) 2022–23 has been selected as base year, as it represents a recent normal year (after COVID), with availability of robust and comprehensive data across sectors of the economy, making it an appropriate benchmark for the new series of Annual and Quarterly National Accounts Estimates. For the new Gross Domestic Product (GDP) series, this press release is structured into three parts.
|
Part A
|
Second Advance Estimates of Annual GDP for FY 2025–26.
Quarterly Estimates of GDP from Q1 (April-June) of FY 2022-23 to Q3 (October-December) of FY 2025-26.
|
|
Part B
|
Annual estimates of GDP and related aggregates for FY 2022–23, 2023–24 and 2024–25.
|
|
Part C
|
Links to access various documents related to New Series including Discussion Papers, Reports of the Sub-committees and FAQs.
Information related to release dates of Back Series and Sources and Methods Publication.
Comparative tables between Old and New series for FY 2022-23, FY 2023-24 and FY 2024-25.
|
* In order to access various linked documents, press note may be accessed from the website of the Ministry (www.mospi.gov.in)
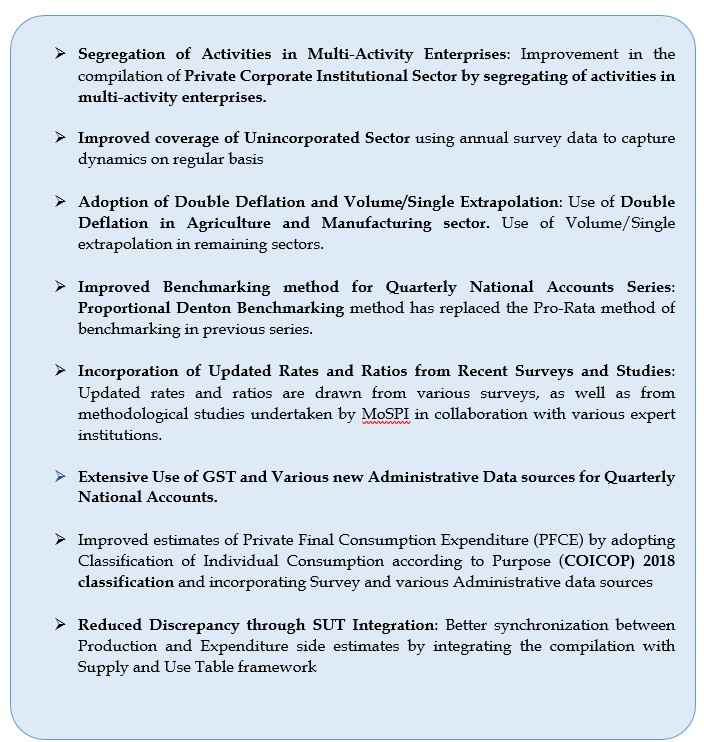
KEY IMPROVEMENTS IN NEW GDP SERIES (BASE YEAR 2022-23)
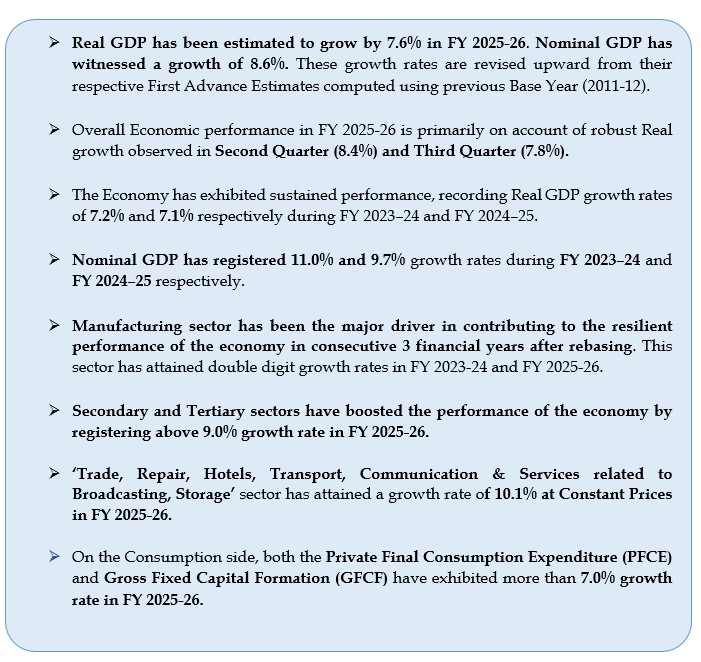
KEY HIGHLIGHTS OF NEW GDP SERIES (BASE YEAR 2022-23)
PART A
NOTE ON
SECOND ADVANCE ESTIMATES OF ANNUAL GROSS DOMESTIC PRODUCT FOR 2025-26
QUARTERLY ESTIMATES OF GROSS DOMESTIC PRODUCT FROM Q1 (APRIL-JUNE) OF 2022-23 TO Q3 (OCTOBER-DECEMBER) OF 2025-26
In the context of the revision of National Accounts’ Base Year to 2022–23, new series of Quarterly GDP estimates and various aggregates are being released. The revised series incorporates following major changes to effectively capture the progress in the economy within respective years.
- Revision in Estimation Methodology
- Incorporation of New High Frequency Indicators
- Improvement in Deflation Strategy
- Improving Granularity of Estimation
Apart from the rebased Quarterly GDP estimates, this part of the press note majorly includes the Second Advance Estimates (SAE) of Annual GDP for the Financial Year (FY) 2025-26 and Quarterly Estimates of GDP for Q3 (October-December) of FY 2025-26. Detailed structure of Part A of the press note is as follows.
|
I
|
Annual GDP Estimates and Growth Rates
|
|
II
|
Quarterly GDP Estimates and Growth Rates
|
|
III
|
Methodology and Major Data Sources
|
|
IV
|
Statements:
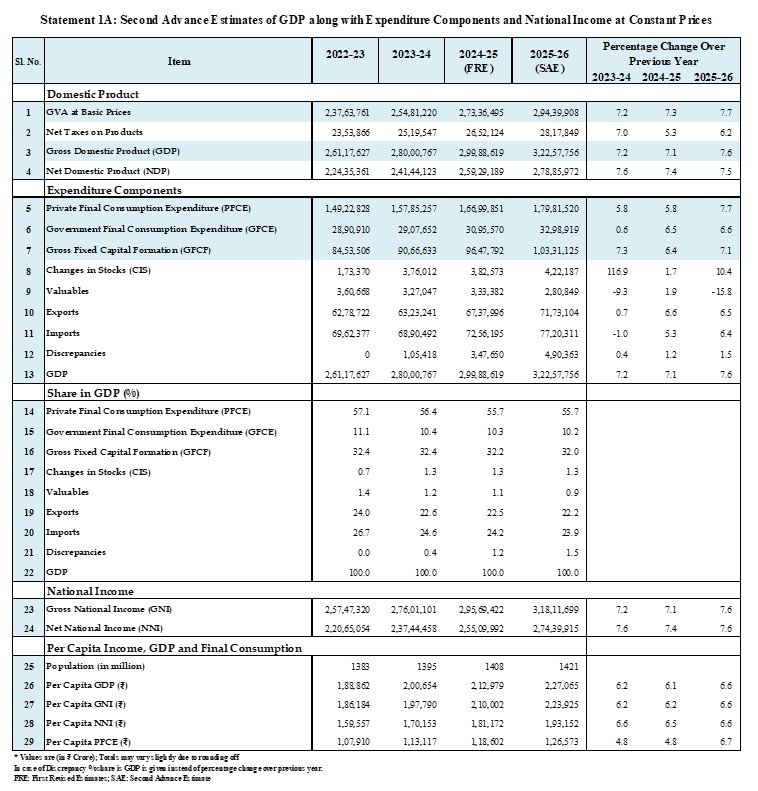
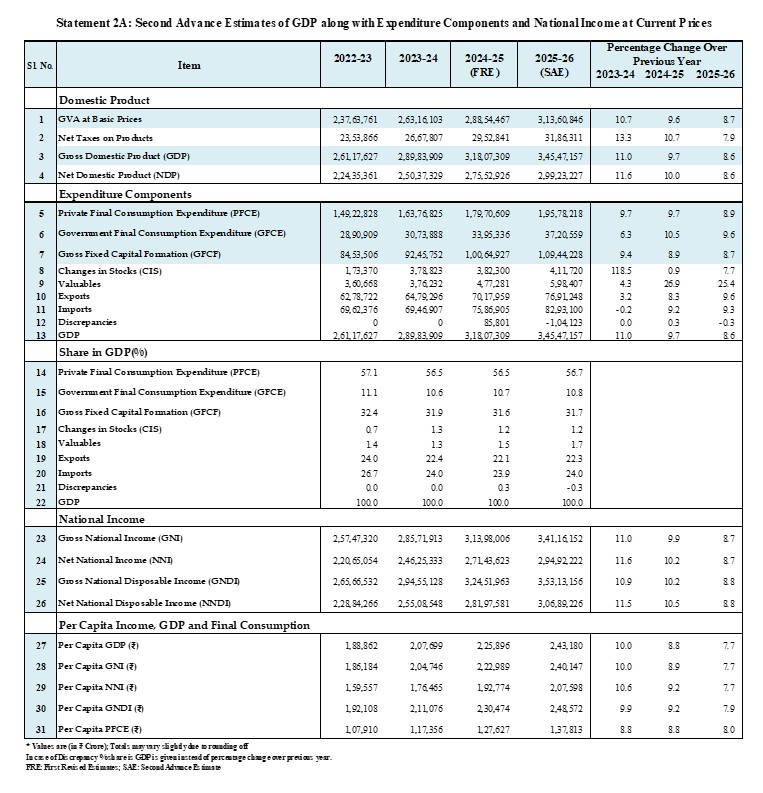
- Second Advance Estimates of GDP along with Expenditure Components and National Income at Constant and Current Prices (Table 1A and 2A)
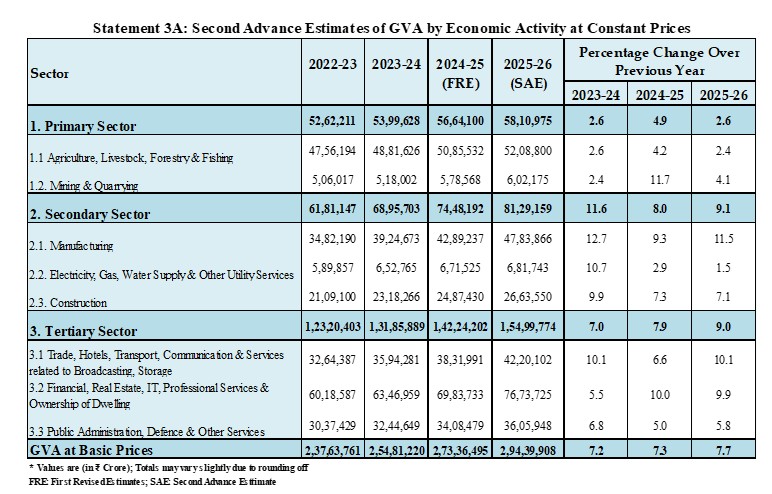
- Second Advance Estimates of GVA at Constant and Current Prices (Table 3A, 4A)
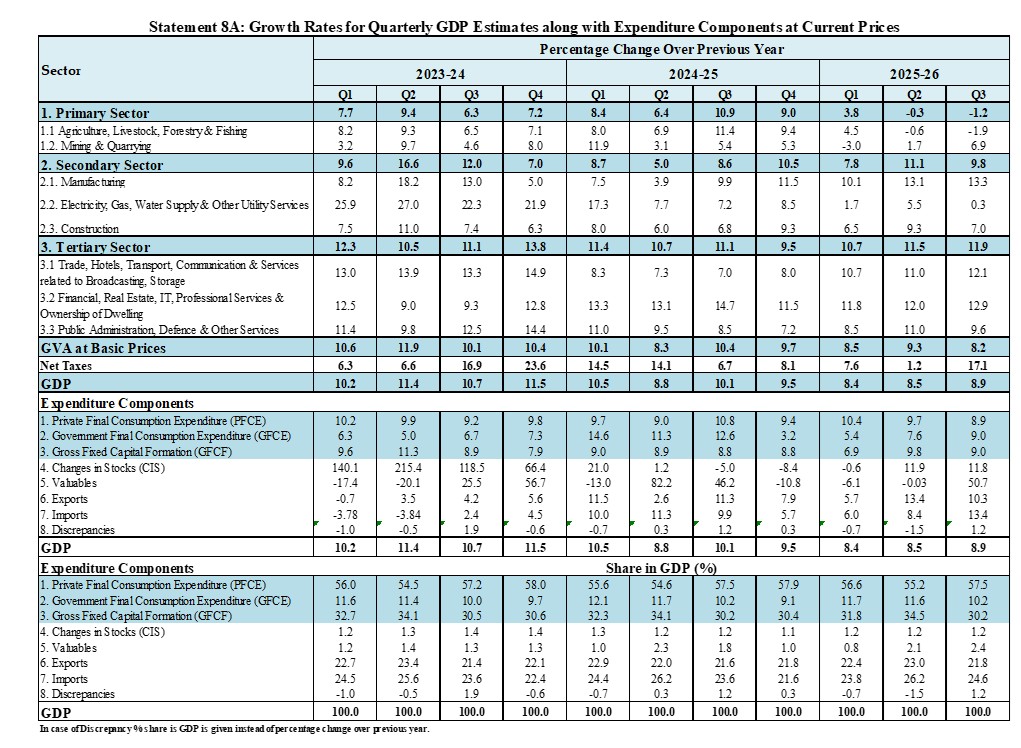
- Quarterly GDP Estimates along with Expenditure Components at Constant and Current Prices (Table 5A, 6A, 7A, 8A)
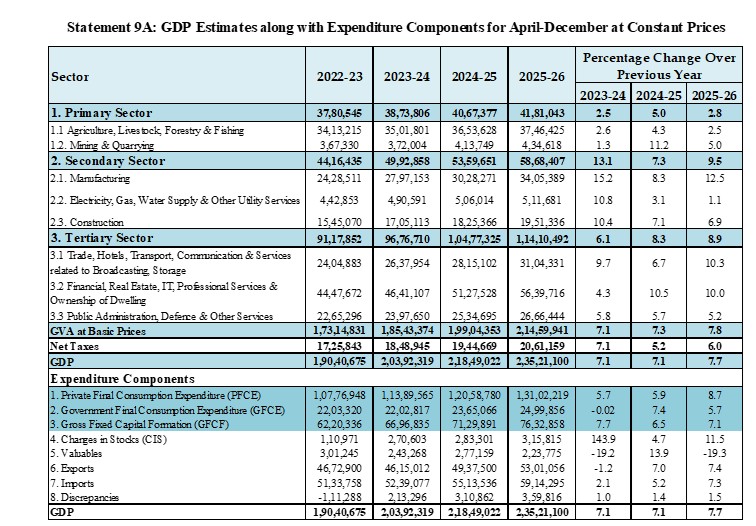
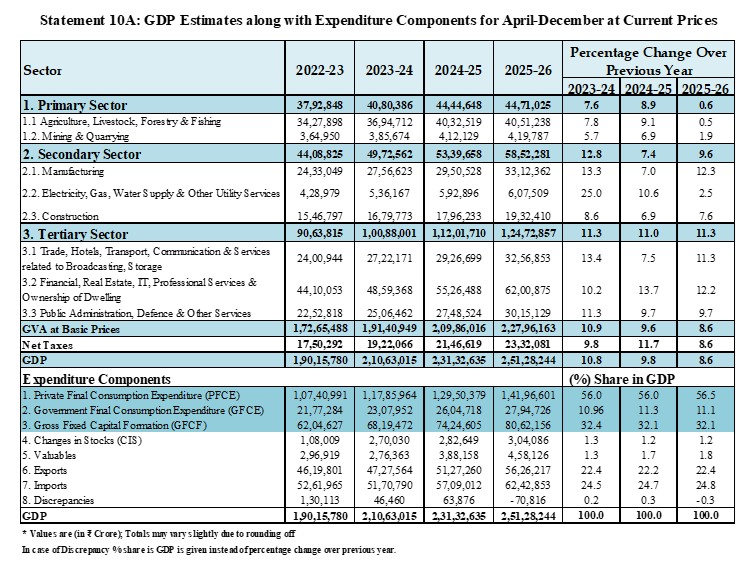
- April-December period GDP Estimates along with Expenditure Components at Constant and Current Prices (Table 9A, 10A)
|
|
Annexures
|
|
I Annual GDP Estimates and Growth Rates
Real GDP or GDP at Constant Prices is estimated to attain a level of ₹322.58 lakh crore in the FY 2025-26, against the First Revised Estimate (FRE) of GDP for the year 2024-25 of ₹299.89 lakh crore. The growth rate in Real GDP during 2025-26 is estimated at 7.6% as compared to 7.1 % in 2024-25. Nominal GDP or GDP at Current Prices is estimated to attain a level of ₹345.47 lakh crore in the year 2025-26, against ₹318.07 lakh crore in 2024-25, showing a growth rate of 8.6%.
Real GVA is estimated at ₹294.40 lakh crore in the year 2025-26, against ₹273.36 lakh crore in FY 2024-25, registering a growth rate of 7.7% as compared to 7.3% growth rate in 2024-25. Nominal GVA is estimated to attain a level of ₹313.61 lakh crore during FY 2025-26, against ₹288.54 lakh crore in 2024-25, showing a growth rate of 8.7%.
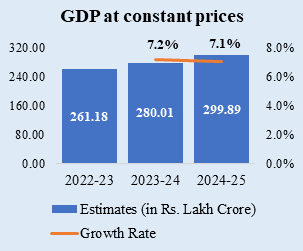
Fig. 1: Annual GDP and GVA Estimates along with Y-o-Y Growth Rates at Constant Prices
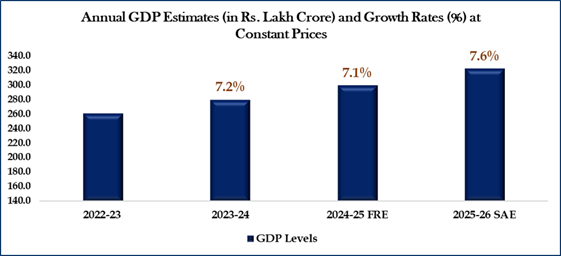
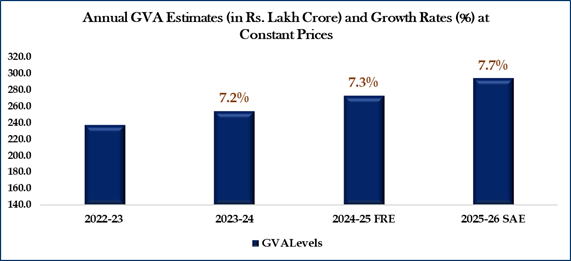
Fig. 2: Sectoral Composition and Growth Rates of Annual GVA
Sectoral Composition of Nominal GVA in FY 2025-26
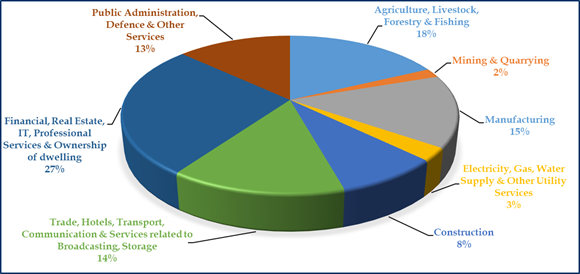
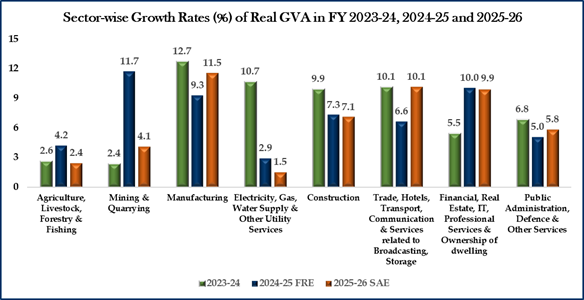
Fig. 3: Composition and Growth Rates of Annual GVA in Broad Sectors
II Quarterly Estimates and Growth Rates
Real GDP or GDP at Constant Prices in Q3 of FY 2025-26 is estimated at ₹84.54 lakh crore, against ₹78.41 lakh crore in Q3 of FY 2024-25, showing a growth rate of 7.8%. Nominal GDP or GDP at Current Prices in Q3 of FY 2025-26 is estimated at ₹90.91 lakh crore, against ₹83.46 lakh crore in Q3 of FY 2024-25, showing a growth rate of 8.9%.
Real GVA in Q3 of FY 2025-26 is estimated at ₹77.38 lakh crore, against ₹71.77 lakh crore in Q3 of FY 2024-25, showing a growth rate of 7.8%. Nominal GVA in Q3 of FY 2025-26 is estimated at ₹82.58 lakh crore, against ₹76.35 lakh crore in Q3 of FY 2024-25, showing a growth rate of 8.2%.
Fig. 4: Quarterly GDP and GVA Estimates along with Y-o-Y Growth Rates at Constant Prices
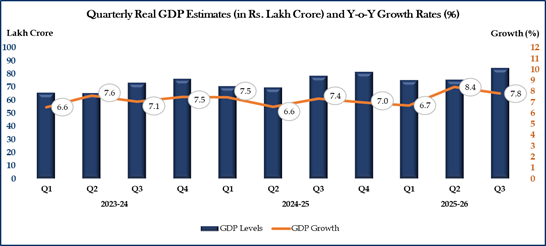
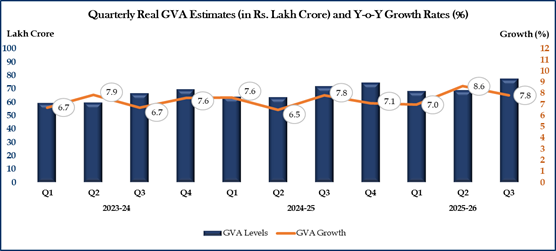
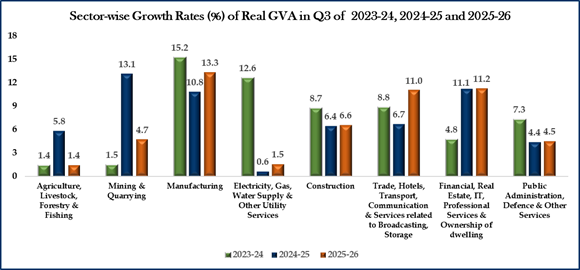
Fig. 5: Sectoral Composition and Growth Rates of Quarterly GVA
Sectoral Composition of Nominal GVA in Q3 of FY 2025-26
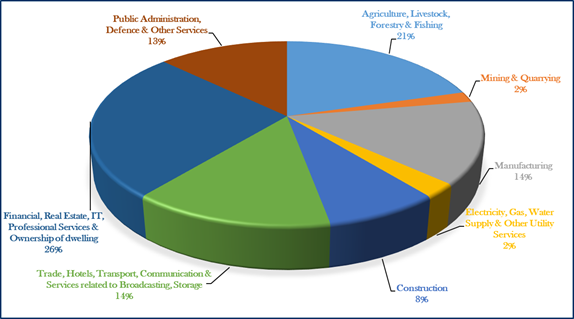
*Public Administration, Defence & Other Services category includes the Other Services sector i.e. Education, Health, Recreation, and other personal services
Fig. 6: Composition and Growth Rates of Quarterly GVA in Broad Sectors
[Primary Sector: Agriculture, Livestock, Forestry & Fishing and Mining & Quarrying
Secondary Sector: Manufacturing; Electricity, Gas, Water supply & Other Utility Services and Construction
Tertiary Sector: Trade, Hotels, Transport, Communication and Services related to Broadcasting, Storage; Financial, Real Estate, IT, & Professional Services, Ownership of Dwelling and Public Administration, Defence & Other Services]
III Methodology and Major Data Sources:
The compilation of Second Advance Estimates of Annual GDP and Quarterly Estimates GDP is based on Benchmark-Indicator methodology in which the estimates computed for the previous financial year are extrapolated using the relevant indicators reflecting the performance of various economic and institutional sectors. The estimates of Quarterly GDP majorly follow the guidelines, standards as mentioned in Quarterly National Accounts Manual of International Monetary Fund (IMF), 2017. These estimates based on New base Year (2022-23) incorporates various methodological changes, new data sources etc. Accordingly, the quarterly estimates series from Q1 of FY 2022-23 has seen a change as compared to the earlier published values, consequential changes in the growth rates are reflected from Q1 of FY 2023-24 onwards. Brief of Revised Methodology, Data Sources and Deflation Strategy in the new series of GDP estimates from Production side is mentioned in the Annexure A2. The Expenditure components of GDP at Quarterly level, has also undergone a change in Methodology of estimation, Data Sources and Deflation Strategy in the new series of GDP estimates, which are presented in Annexure A3.
As per the Advance Release calendar of the Ministry, the Provisional Estimates of Annual GDP for FY 2025-26 along with Quarterly GDP estimates for the quarter January-March of FY 2025-26 (Q4, 2025-26) will be released on 29.05.2026.
IV Statements (Part A)
Annexure A1
Year-on-Year Growth Rate (%) in Indicators
|
Indicators
|
FY 2025-26
|
|
Q1
|
Q2
|
Q3
|
|
Cement Production Index
|
8.0
|
7.3
|
11.2
|
|
Finished Steel Consumption
|
7.9
|
8.8
|
3.9
|
|
IIP Infrastructure/ Construction Goods
|
6.0
|
11.6
|
10.7
|
|
IIP Electricity
|
-1.5
|
3.7
|
-0.9
|
|
Natural Gas Consumption
|
-8.7
|
-0.9
|
0.6
|
|
Sales of Commercial Vehicles
|
-0.6
|
8.6
|
21.5
|
|
Sales of Three Wheelers
|
0.1
|
9.8
|
14.0
|
|
Cargo Handled at Major Ports
|
5.6
|
5.9
|
13.2
|
|
Cargo Handled at Minor Ports
|
-0.4
|
3.5
|
0.8
|
|
Air Passenger Traffic and Cargo handled (Scheduled Domestic Service)
|
6.7
|
-0.2
|
4.2
|
|
Air Passenger Traffic and Cargo handled (Scheduled International Service)
|
8.4
|
3.7
|
14.9
|
|
Railway Net Tonne Km
|
0.7
|
2.3
|
0.6
|
|
Railway Passenger Km.
|
3.0
|
1.2
|
13.0
|
|
Central Goods and Services Tax (CGST)
|
1.5
|
10.4
|
5.1
|
|
Custom Duty
|
-9.9
|
-1.8
|
54.9
|
|
Union Excise
|
8.3
|
8.0
|
13.1
|
|
Household Vehicle Registration
|
5.2
|
1.8
|
19.8
|
|
Passenger Transport Vehicle Registration
|
8.0
|
-1.2
|
20.9
|
|
Goods Transport Vehicles Registration
|
2.6
|
4.9
|
24.1
|
|
IIP (Manufacture of Other Transport Equipment
|
2.1
|
9.5
|
14.2
|
|
IIP Manufacture of computer, electronic and optical products
|
1.3
|
4.4
|
19.4
|
|
IIP Manufacture of Electrical Equipment
|
8.5
|
18.1
|
1.5
|
|
IIP Manufacture of machinery and equipment n.e.c.
|
8.4
|
3.1
|
5.1
|
|
Import of Transport Goods
|
-22.5
|
5.9
|
4.1
|
|
Import of Machinery Equipment
|
16.6
|
14.0
|
21.8
|
Annexure A2
Methodology, Data Sources and Deflation Strategy in the New series of Quarterly GDP estimates (Production Side)
|
Sector
|
Major Data Sources
|
Deflation Strategy
|
Revision in Methodology
|
|
Agriculture & Allied sector
|
Quarter-wise estimates of various crops including additional crops in the new series
Season-wise estimates of Major Livestock Products
Quarterly estimates of Inland and Marine Fish
|
Volume Extrapolation at granular level for each sub-sector
|
Change in the Benchmarking method:
Proportional Denton methodology in the new series against the Pro-Rata method in old series.
Revision in Quarterization pattern based on sector or sub-sector specific indicators for the year 2022-23
Revision in quarterly Estimation methodology in various sectors, such as Manufacturing, Financial services, Public Administration & Defence etc.
Revision in the Deflation strategy: Switched to Single/Volume Extrapolation for all sectors (except manufacturing). For manufacturing, Double Deflation method is applied. Use of Item-level relevant WPI and CPI for Single Extrapolation and Double Deflation purpose.
Improving Granularity of Estimation and Coverage.
|
|
Mining & Quarrying
|
Item level IIPs
|
Volume Extrapolation
|
|
Manufacturing
|
Quarterly Financial Results of Listed Manufacturing Companies
GST data by Constitution of Business
|
Double Deflation
|
|
Electricity, Gas, Water supply, Remediation & Other utility services
|
IIP Electricity
Natural Gas Consumption
SAC-wise GST data along with Constitution of Business
|
Volume Extrapolation for Electricity, Gas.
Single Extrapolation for Water supply, Remediation & Other utility services
|
|
Construction
|
Cement Production Index
Finished Steel Consumption
Item level IIPs
IIP Infrastructure and Construction Goods
|
Volume Extrapolation in various input items
|
|
Trade, Repair, Hotels, Transport Communication & Services related to broadcasting, Storage
|
Quarterly Financial Results of Listed Companies
SAC and Constitution of Business-wise GST data
Stock and Sales of Commercial Vehicles and Three Wheelers
Cargo Handled at Major and Minor Ports
Domestic and International Air Traffic statistics
Railway Net Tonne and Passenger Km. information
Railway Goods and Passenger earning information
Data Usage, Telephone Subscribers, Minutes of Usage and other related parameters for Telecommunication
|
Single Extrapolation at institutional and economic sub-sectors for Trade, Hotels, Storage, Services Related to Broadcasting
Volume Extrapolation at respective economic sub- sectors for Transport and Communication
|
|
Financial, Real Estate, IT Professional services and Ownership of Dwelling
|
Information on Loans, Deposit, Interests for Public, Foreign, Private and Small Finance Banks
Compensation of Employees for RBI
Information on Loans, Deposit, Interests for Non-Banking Financial Corporations
Quarterly Financial Results of Listed Financial Auxiliaries
Quarterly Financial Results Insurance Companies.
SAC and Constitution of Business-wise GST data
|
Volume Extrapolation for Financial services sub-sectors
Single Extrapolation at institutional sector and economic sub-sectoral level for Real Estate, IT Professional services and Ownership of Dwelling
|
|
Public Administration and Other Services
|
Information on Salary and Wages from State Governments
Information on Compensation of Employees for Central Government from PFMS
SAC-wise GST data along with Constitution of Business
|
Single Extrapolation at institutional sector and economic sub-sectoral level
|
|
Tax
|
GST collection and other Tax components for Central and State Governments
|
Volume Extrapolation
|
|
Subsidy
|
Product Subsidy data for Centre and States
|
Volume Extrapolation and Single Deflation for various subsidy components
|
Annexure A3
Methodology, Data Sources and Deflation Strategy in the Quarterly Expenditure-side Components of New GDP Series
|
Expenditure Components
|
Major Data Sources
|
Deflation Strategy
|
Revision in Methodology
|
|
Private Final Consumption Expenditure (PFCE)
|
Household Consumption Expenditure Survey for quarterization
GVO of various sectors relevant to items of PFCE
Import and Export data for various services items
Vehicle Category and Class wise Registered vehicles and Sales (in amount) value from e-VAHAN portal and Ministry of Road Transport and High Ways
Item level IIPs
Offtake information for Rice and Wheat for Public Distribution System
|
Extrapolation or Deflation at granular level for each item. Item-wise relevant CPIs used for deflation.
|
Change in the Benchmarking methodology:
Proportional Denton methodology in the new series against the Pro-Rata method.
Revision in Quarterization pattern based on various new data sources for various components. Majorly quarterization strategy of PFCE has seen a change as per HCES data.
Revision in the Deflation strategy: Use of Item level WPI and CPI, Principal Commodity-wise Unit Value Index (UVI), CPI (IW) etc.
Improving Granularity of Estimation and Coverage.
|
|
Government Final Consumption Expenditure (GFCE)
|
Information on Salary Wages for State and Central Governments
Information on Food Subsidy
Procurement information of Food Corporation of India
|
Deflation and Volume Extrapolation for Compensation of Employees, Food Subsidy respectively
|
|
Gross Fixed Capital Formation (GFCF)
|
Item level IIPs and IIP at NIC 2-digit level
Import and export of various assets
|
Deflation at asset category level using relevant WPIs or CPIs
|
|
CIS
|
Growth majorly observed in (Output-IC-PFCE) for various industries
|
|
Valuables
|
Import and Export of Gold, Silver and other valuables
|
Deflation by computing CPI for Valuables using relevant items
|
|
Exports
|
Principal Commodity-wise Export and Unit Value Index
|
Goods: Deflation using UVI across the Principal Commodities
Services: Using IPD of relevant services sectors
|
|
Imports
|
Principal Commodity-wise Import and Unit Value Index
PPI of major Importing countries for India and exchange rate of countries
|
Goods: Deflation using UVI at Principal Commodities level
Services: Based on PPI of major Importing countries
|
PART B
NOTE ON
REVISED ESTIMATES OF GROSS DOMESTIC PRODUCT, NATIONAL INCOME, CONSUMPTION EXPENDITURE, SAVING AND CAPITAL FORMATION FOR 2022-23. 2023-24 & 2024-25
In this part of the press note, First Revised Estimates of National Income, Consumption Expenditure, Saving and Capital Formation for the financial year 2024-25 and estimates for the financial year 2023-24 and 2022-23, as per the New Base Year (2022-23) are given.
The First Revised Estimates for the year 2024-25 have been compiled using industry-wise/institution-wise detailed information instead of using the benchmark-indicator method employed at the time of release of Provisional Estimates on 30th May, 2025. The estimates of Gross Domestic Product (GDP) and other aggregates for the year 2022-23 and 2023-24 have also undergone revisions on account of base year revision as well as use of latest available datasets on agricultural production; industrial production (final results of Annual Survey of Industries: 2023-24); government data as available through PFMS and in budget documents (replacing Revised Estimates with actuals for the year 2023-24); comprehensive data available from various source agencies like Ministry of Corporate Affairs (MCA), Reserve Bank of India (RBI), National Bank for Agriculture and Rural Development (NABARD), e-Vahan data, etc. and additional data from State/UT Directorates of Economics and Statistics (DES).
The salient features of the key macro-economic aggregates in the new series estimates are given in the succeeding paragraphs.
Gross Domestic Product
GDP for the base year 2022-23 is estimated as ₹261.18 lakh crore. Real GDP or GDP at constant prices for the years 2023-24 and 2024-25 stands at ₹280.01 lakh crore and ₹299.89 lakh crore, respectively, showing a growth of 7.2% during 2023-24, and 7.1% during 2024-25.
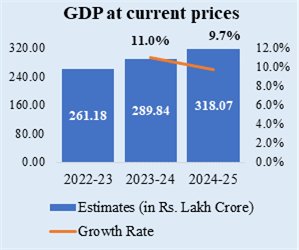
Nominal GDP or GDP at current prices for the years 2023-24 and 2024-25 stands at ₹289.84 lakh crore and ₹318.07 lakh crore, respectively, exhibiting a growth of 11.0% during 2023-24, and 9.7% during 2024-25.
GVA and its Industry-wise Analysis
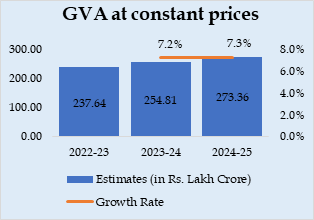
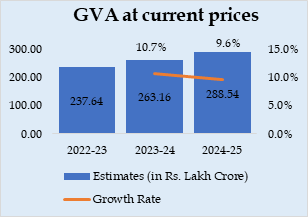
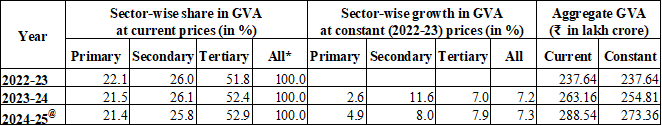
At the aggregate level, Nominal Gross Value Added (GVA) at basic prices has increased by 9.6% during 2024-25 compared to growth of 10.7% during 2023-24. Real GVA or GVA at constant prices, has increased by 7.3% in 2024-25, compared to 7.2% growth in 2023-24.
The shares of broad sectors of the economy in overall GVA during 2022-23 to 2024-25 and the annual growth rates during these periods are mentioned below:
Sector-wise share in GVA at current prices for the years 2022-23, 2023-24 and 2024-25
|
|
* The sector-wise figures may not add up to 100 due to rounding off.
@: First Revised Estimates
[i] Primary indicates agriculture, livestock, forestry, fishing and mining & quarrying industries
|
|
[ii] Secondary indicates manufacturing, electricity, gas, water supply & other utility services and construction
|
|
[iii] Tertiary indicates all services
|
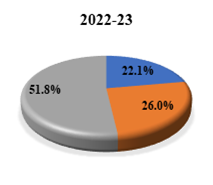
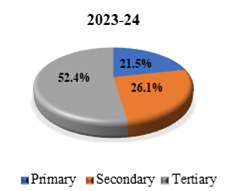
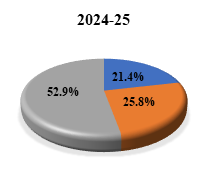
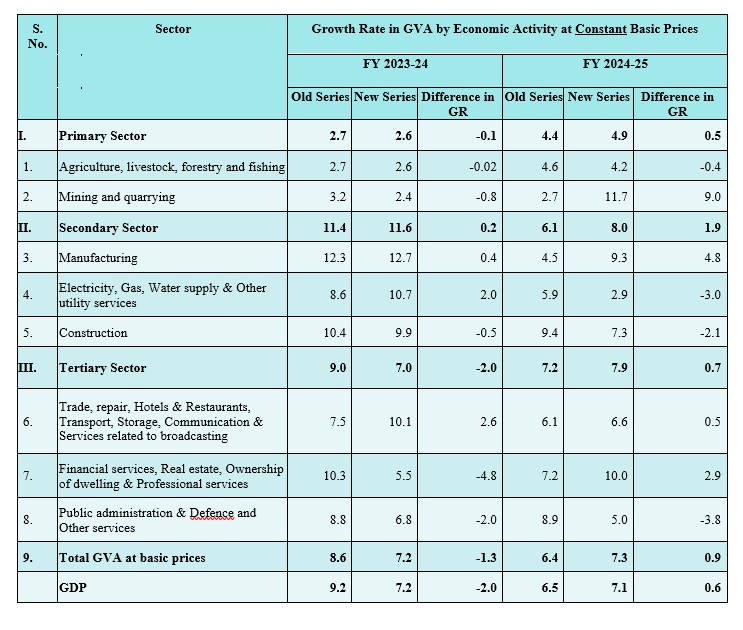
The growth rates of Primary sector (comprising Agriculture, Livestock, Forestry, Fishing and Mining & Quarrying), Secondary sector (comprising Manufacturing, Electricity, Gas, Water Supply & Other Utility Services, and Construction) and Tertiary sector (Services) have been estimated as 4.9%, 8.0% and 7.9% respectively in 2024-25 as against growth rates of 2.6%, 11.6% and 7.3% respectively in 2023-24. The growth in real GVA during 2024-25 is primarily on account of growth in ‘Manufacturing’, ‘Mining & Quarrying’, ‘Construction’, ‘Financial Services’ and ‘Real Estate, Ownership of Dwelling & Professional Services’ as may be seen from Statement 4.2B. However, ‘Agriculture, Livestock, Forestry and Fishing’, ‘Electricity, Gas, Water Supply & Other utility services’ and ‘Other services’ have witnessed modest growth during 2024-25.
Net National Income
Net National Income (NNI) at current prices for the year 2024-25 stands at ₹271.44 lakh crore as against ₹246.25 lakh crore in 2023-24, showing a growth of 10.2 % during 2024-25 as compared to growth of 11.6 % in 2023-24.
Gross National Disposable Income
Gross National Disposable Income (GNDI) at current prices is estimated at ₹324.52 lakh crore for the year 2024-25, while the estimate for the year 2023-24 stands at ₹294.55 lakh crore, showing a growth of 10.2 % for year 2024-25 as compared to growth of 10.9 % in the year 2023-24.
Savings
Gross Saving during 2024-25 is estimated at ₹111.13 lakh crore against ₹95.17 lakh crore during 2023-24. The major share in Gross Saving during 2024-25 is 62.1% in Household sector and 28.9% in Non-financial corporations. Savings of household sector have increased, thereby strengthening the domestic resource base for investment and capital formation. This indicates improved financial resilience of household sector and greater availability of funds for sustainable economic growth in long run. Savings in physical assets as well as valuables have increased during 2022-23 to 2024-25.
Capital Formation
Gross Capital Formation (GCF) at current prices is estimated at ₹109.25 lakh crore for the year 2024-25 as compared to ₹100.00 lakh crore during 2023-24. The rate of GCF to GDP is 34.3 % during 2024-25 as against 34.5 % in the 2023-24.
The rate of GCF to GDP at constant prices was 34.9 % in 2023-24 and 34.6 % in 2024-25.
Consumption Expenditure
Private Final Consumption Expenditure (PFCE) at current prices is estimated at ₹179.71 lakh crore for the year 2024-25 as against ₹163.77 lakh crore in 2023-24. In relation to GDP, the PFCE to GDP ratio at current prices is 56.5% for both 2023-24 and 2024-25. At constant prices, the PFCE is estimated at ₹157.85 lakh crore and ₹167.00 lakh crore, respectively for the years 2023-24 and 2024-25. The corresponding PFCE to GDP ratio for the years 2023-24 and 2024-25 are 56.4% and 55.7% respectively.
Government Final Consumption Expenditure (GFCE) at current prices is estimated at ₹33.95 lakh crore for the year 2024-25 as against ₹30.74 lakh crore during 2023-24. At constant prices the estimates of GFCE for the years 2023-24 and 2024-25 stand at ₹29.08 lakh crore and ₹30.96 lakh crore respectively.
Per Capita Estimates
Per Capita Income i.e. Per Capita Net National Income at current prices for the years 2022-23, 2023-24 and 2024-25 is estimated at ₹1,59,557, ₹1,76,465 and ₹1,92,774, respectively. Per Capita PFCE at current prices, for the years 2022-23, 2023-24 and 2024-25 is estimated at ₹1,07,910, ₹1,17,356 and ₹1,27,627 respectively.
Detailed statements
More details of the New Series Estimates for FY 2022-23, 2023-24 and 2024-25 are available in Statements 1.1B to 9B provided in the pdf format of the Press Note (link given at the end) and also can be accessed from the website of the Ministry of Statistics and PI (https://www.mospi.gov.in/themes/product/6-gross-domestic-product#latest-release).
- Statement 1.1B: Key Aggregates of National Accounts at Current Prices
- Statement 1.2B: Key Aggregates of National Accounts at Constant (2022-23) Prices
- Statement 2B: Per Capita Income, Product and Final Consumption
- Statement 3.1B: Output by Economic Activity and Capital Formation by Industry of Use at Current Prices
- Statement 3.2B: Output by Economic Activity and Capital Formation by Industry of Use at Constant (2022-23) Prices
- Statement 4.1B: Gross Value Added by Economic Activity at Current Basic Prices
- Statement 4.2B: Gross Value Added by Economic Activity at Constant (2022-23) Basic Prices
- Statement 5B: Finances for Gross Capital Formation
- Statement 6.1B: Gross Capital Formation by Industry of Use at Current Prices
- Statement 6.2B: Gross Capital Formation by Industry of Use at Constant (2022-23) Prices
- Statement 7.1B: Gross Fixed Capital Formation by Asset & Institutional Sector at Current Prices
- Statement 7.2B: Gross Fixed Capital Formation by Asset & Institutional Sector at Constant (2022-23) Prices
- Statement 8.1B: Private Final Consumption Expenditure at Current Prices
- Statement 8.2B: Private Final Consumption Expenditure at Constant Prices
- Statement 9B: Institutional Sectors – Key Economic Indicators at Current Prices
FORMULAE
- GVA at basic prices (Production Approach) = Output at basic price – Intermediate Consumption
- GVA at basic prices (Income Approach) = CE + OS/MI + CFC + Production taxes less Production subsidies(i)
- GDP = ∑ GVA at basic prices + Product taxes less Product subsidies(ii)
- NDP/NNI = GDP/GNI - CFC
- GNI = GDP + Net primary income from ROW (Receipts less payments)
- Primary Incomes = CE + Property and Entrepreneurial Income
- NNDI =NNI + other current transfers(iii) from ROW, net (Receipts less payments)
- GNDI = NNDI + CFC = GNI + other current transfers(iii) from ROW, net (Receipts less payments)
- Gross Capital Formation (GCF)(iv) (Financing Side) = Gross Savings + Net Capital Inflow from ROW
- GCF (Expenditure Side) = GFCF + CIS + Valuables
- Gross Disposable Income of Govt. = GFCE + Gross Saving of General Government
- Gross Disposable Income (GDI) of Households = GNDI – GDI of Govt. – Gross Savings of All Corporations
REMARKS ON THE FORMULAE
- Production taxes or subsidies are paid or received with relation to production and are independent of the volume of actual production. Some examples are:
Production Taxes - Land Revenues, Stamps & Registration fees and Tax on profession
Production Subsidies - Subsidies to Railways, Subsidies to village and small industries.
- Product taxes or subsidies are paid or received on per unit of product. Some examples are:
Product Taxes- Goods & Service Tax, Excise duties, Sales tax, Service Tax and Import, Export duties
Product Subsidies- Electricity, Petroleum and Fertilizer subsidies.
- Other Current Transfers refers to current transfers other than the primary incomes.
- Gross Capital Formation (GCF) at the current as well as the constant prices is estimated by two approaches: – (a) through flow of funds, derived as Gross Saving plus net capital flow from Rest of the World (RoW); and (b) by the commodity flow approach, derived by the type of assets.
PART C
BASE YEAR REVISION OF NATIONAL ACCOUNTS
ACNAS:
MoSPI associates technical experts and representatives of central ministries and State/Union Territory Directorates of Economic and Statistics (DES) with the compilation of National Accounts Statistics (NAS). This is in the form of Advisory Committee on National Accounts Statistics (ACNAS), which is a permanent standing committee and is reconstituted from time to time.
At present, the ACNAS is headed by Prof. Biswanath Goldar. The role of the committee is to advises MoSPI, among other things, on inclusion of new data sources and on the methodology for compilation and presentation of National Accounts Statistics for purposes of economic analysis and policy. On the recommendation of the Committee, base year of national accounts is being revised from 2011-12 to 2022-23.
Sub-committees for Base Revision:
Under ACNAS, five Sub-committees, with a term of two years, have been constituted to simultaneously deliberate upon specific subjects. Reports of first three sub-committees dealing with all-India estimates are available on the website of the Ministry, which have been hyperlinked to the names of respective sub-committees as given below. Reports of other two sub-committees will be released later.
I. Sub-committee for Incorporation of New Data Sources, Rates and Ratios
II. Sub-committee for Methodological Improvement
III. Sub-committee for Constant Price Estimates
IV. Sub-committee on Regional Accounts
V. Sub-committee for SNA 2025 Update
Discussion Papers and Key Improvements:
The methodological improvements in new series of National Accounts has been a crucial step in aligning with structural changes for achieving the long-term vision towards Viksit Bharat. Details of improvements in the new series are documented in discussion papers, one each on ‘Production Approach’, ‘Expenditure Approach’ and ‘Quarterly GDP & Sub-national Accounts’ released by the Ministry. These discussion papers are available on the website of the Ministry. Some of the major improvements in the new series are summarized below:
- Increased dynamism in measuring household sector: In the old series, household sector was estimated either through inter-survey growths or through some proxy indicators. In the new series, level estimates of the household sector will be compiled through regular surveys – Annual Survey of Unincorporated Sector Enterprise (ASUSE) and Periodic Labour Force Survey (PLFS) - being conducted each year.
- Use of Double Deflation or Single Extrapolation: In the new series, double deflation will be used in manufacturing and agriculture industries and single extrapolation elsewhere. As such single deflation has been completely done away with. Besides, deflators will be used at a more granular level.
- Lower Discrepancy: Supply Use Table Framework will be integrated with National Accounts Framework to minimize the discrepancy between GDP from production and expenditure approaches. SUT shows what industries produce (Supply) and how products are used by industries or final consumers (Use). Balanced SUT ensures that total supply matches total demand in the economy. So, integration of SUT framework with National Accounts Framework will help minimize discrepancy in new series.
- Use of updated rates/ratios from various studies and surveys: Rates and ratios used in compilation will be revised in new series either from surveys which have come up in the intervening period or through studies conducted by MoSPI in collaboration with other expert organizations.
- Segregation of activities in case of multi activity private corporations: In the old series, total value added of multi activity enterprises was allocated to the major activity. However, as administrative data has become available in the intervening period, where corporations are mandated to report activity-wise share in turnover, the same will be used to segregate the total value added (and other aggregates) in different activities.
- Private Final Consumption Expenditure (PFCE): In the new series, estimation of PFCE is more nuanced through use of mixed approach (a) enhanced use of Household Consumer Expenditure Survey (b) Direct estimation based on production and other data sources (c) Commodity flow approach. Besides, latest relevant standard i.e. COICOP 2018 has also been adopted in compilation of PFCE.
- Use of new data sources: Digitization of records has led to accessibility of new and more granular database in a digitized form. New data sources like Goods and Services Tax (GST) data, Public Finance Management System (PFMS), E-vahan etc., which are more comprehensive and available at a shorter time lag, have been explored for augmenting the existing data sources for compilation and corroboration of estimates.
Sources and Methods:
Methodology and data sources used in compilation of estimates are presented comprehensively in MoSPI’s publication ‘Source and Methods’. The publication is scheduled to be released by August 2026.
FAQs:
In order to facilitate users of national accounts data to have easy access of new series and to provide users immediate answers to some of the most common questions, FAQs have been uploaded on the website.
Use of Revised WPI/PPI:
Since the base year of indices (Wholesale Price Index/ Producer Price Index and Index of Industrial Production) are being revised, the constant price estimates of the new series would be revised thereafter.
Back Series:
As per the past practice for calculation of Back Series in India, estimates are recalculated using revised methodology of the new series till the immediate preceding base and spliced at disaggregated level, thereafter, till 1950-51. A judicious approach combining splicing and recalculation, aligned with the international best practice, will be used. However, the methodology for back series will be finalized in consultation with the advisory committee which has been constituted to advise the Ministry on methodological improvements and incorporation of new data sources in compilation of GDP estimates. Back series is expected to be released by December 2026.
Estimates:
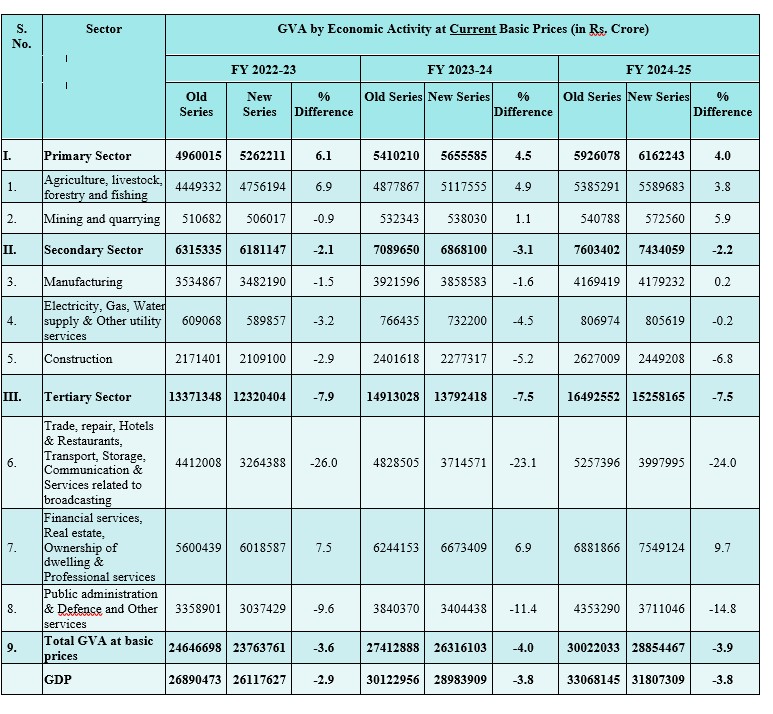
Industry-wise estimates for FY 2022-23, FY 2023-24 and FY 2024-25 for both old and new series and reasons for revision in estimates are given at Annexures.
******
Annexure-I
Industry-wise GVA estimates: Old vs New Series (at Current Prices)
Annexure-II
Growth Rate in Industry-wise GVA estimates: Old vs New Series (at Constant Prices)
Annexure-III
Aggregates from Expenditure Approach: Old vs New Series (at Current Prices)
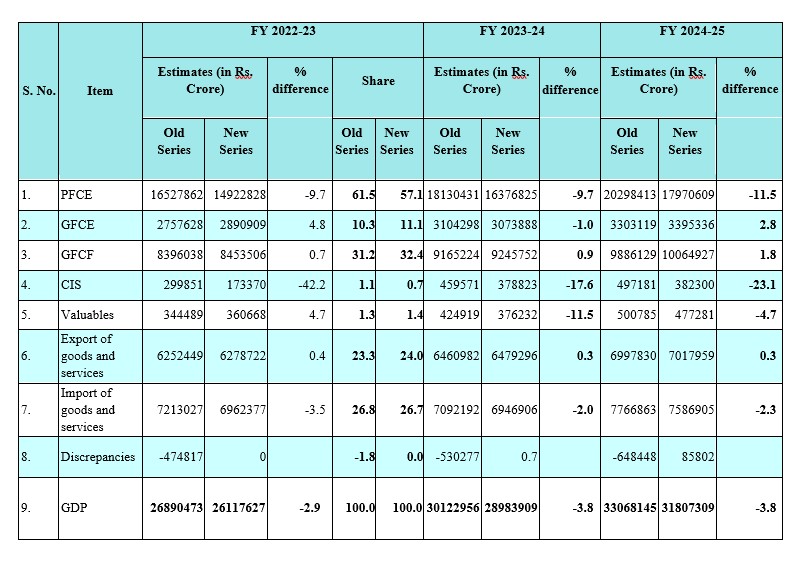
* Share is given in case of discrepancy.
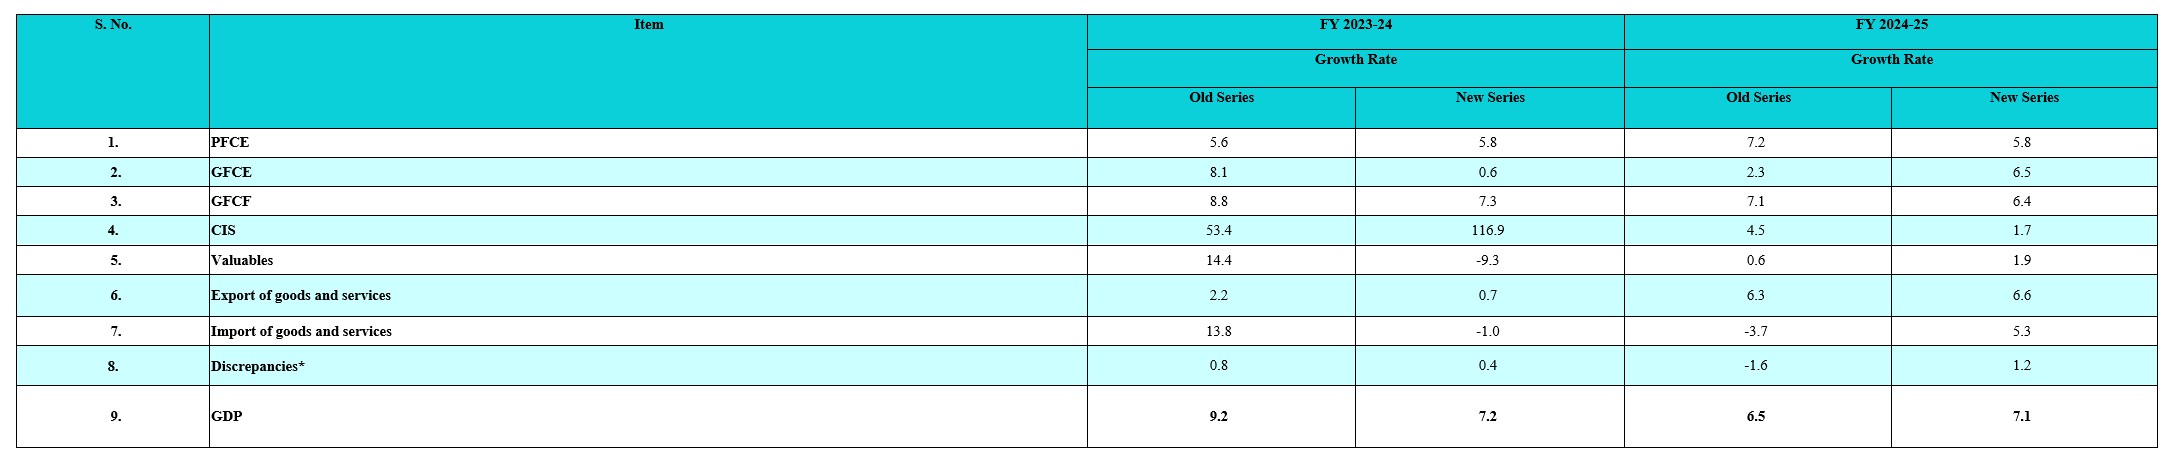
Annexure-IV
Aggregates from Expenditure Approach: Old vs New Series (at Constant Prices)
Annexure-V
Brief Reasons for data revisions in the new series of GDP estimates (Base Year: 2022-23)
|
Industry
|
Level Estimate (FY 2022-23)
|
FY 2023-24
|
FY 2024-25
|
|
Agriculture & Allied sector
|
Crop: (i)Inclusion of new fruits and vegetables (ii) Updation of rate and ratio for production of grass and fodder (iii)drop in input value (electricity, diesel)
Livestock, fisheries: Increased input rate
Forestry: Updated state-wise input rate
|
Revised prices received from states.
|
Prices provided by States have been used in place of use of WPI adjusted price in provisional estimates.
|
|
Mining & Quarrying
|
No significant change
|
- Revision of data of Minor Minerals by States.
- Change in Methodology for constant price estimation based on volume extrapolation in place of single deflation.
|
- Use of detailed data from MCA and States against indicator (Index of Industrial Production (IIP)) based provisional estimates.
|
|
Manufacturing
|
Segregation of multi-activity of Private Corporate data of MCA.
|
No significant change in growth rate.
|
- Use of detailed MCA, NDE and ASUSE & PLFS data in lieu of provisional estimates based on limited data.
- use of double deflation and single extrapolation in the new series in place of single deflation (old series) for constant price estimate
|
|
Electricity, Gas, Water supply & Other utility services
|
Use of direct estimate from ASUSE and PLFS data for the quasi-corporate and household sector in new series in place of indicators-based estimates in old series.
|
- Same as for 2022-23 for current price estimates.
- Volume extrapolation (Electricity, Gas) and Single Extrapolation (for Others) in the new series in place of single deflation used in old series.
|
- Use of detailed data from MCA, Non-Department Enterprises (NDE), Government Budget documents and ASUSE as against Indicator based provisional estimates.
|
|
Construction
|
Updated/ revised Rates and ratios based on latest survey undertaken by National Sample Survey (NSS) on Construction are used in new series.
|
- Use of latest ASI data for deriving total production and availability of input items for construction.
- Use of single extrapolation in place of single deflation for constant price estimates.
|
Same as above.
|
|
Trade, Repair, Hotel & Restaurants
|
Use of direct estimate from ASUSE and PLFS data for the quasi-corporate and household sector in new series in place of indicators-based estimates in old series.
|
- Same as for 2022-23 for current price estimates.
|
Same as above.
|
|
Transport, Storage, Communication & broadcasting
|
Same as above.
|
Same as above.
|
Same as above.
|
|
Financial services
|
Expansion of coverage of private Non-Banking Financial Corporations (NBFCs) using MCA data.
|
No significant change in the growth rate.
|
No significant change in the growth rate.
|
|
Real estate, Professional services and Ownership of dwelling
|
In the new series, estimate of the total dwelling has been updated based on the projected population (source: MoH&FW) and the latest household size from survey data.
|
- Use of ASUSE & PLFS data in place of indicator growth derived from Corporate sector for unincorporated sector.
- Single extrapolation based on CPI of relevant items in place of single deflation using mix of CPI, WPI.
|
- Use of detailed data from MCA, Non-Department Enterprises (NDE), Government Budget documents and ASUSE as against Indicator based provisional estimates.
|
|
Public administration and Defence
|
Due to adjustment in pension payments.
|
Estimates of States and Defence are based on actual Expenditure instead of Revised Estimates.
|
- Use of detailed data from Government Budget documents and sates as against Indicator based provisional estimates.
|
|
Other services
|
For quasi-corporate and household sector, instead of extrapolation using inter-survey growth of NSS, annual results of ASUSE & PLFS have been used.
|
- Use of ASUSE & PLFS data in place of indicators from Inter-survey growth for unincorporated sector.
- Single extrapolation based on CPI of relevant items against single deflation using CPI of the same items for constant price estimates.
|
Use of detailed data from MCA, Non-Department Enterprises (NDE), Government Budget documents and ASUSE as against Indicator based provisional estimates.
|
Click here to download in PDF Format
*****
Samrat
(Release ID: 2233518)
Visitor Counter : 32432