Ministry of Statistics & Programme Implementation
Periodic Labour Force Survey (PLFS) Annual Report, 2025 [January, 2025 – December, 2025]
प्रविष्टि तिथि:
27 MAR 2026 4:00PM by PIB Delhi
Snapshot
- LFPR and WPR, based on usual status (ps+ss) remained stable in the year 2025 compared with 2024.
- Unemployment rate in usual status (ps+ss) among educated persons (secondary and above) reduced to 6.5% in 2025 from 7.0% in 2024 in the age group 15 years and above.
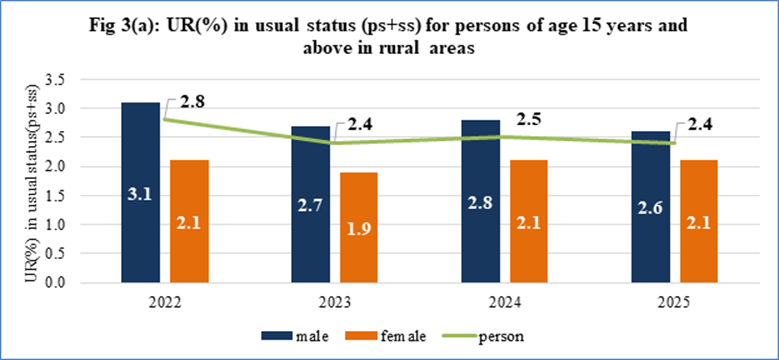
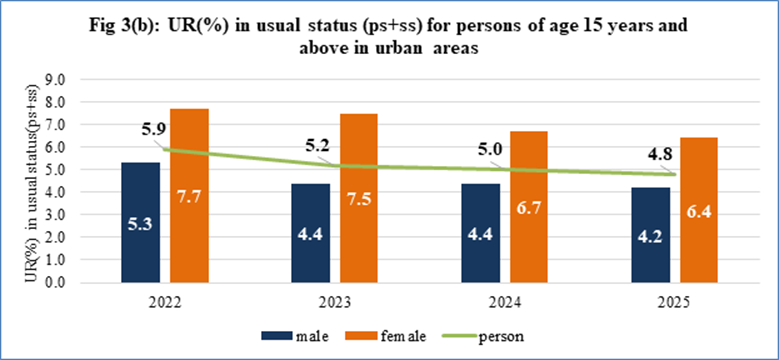
- Unemployment rate according to usual status (ps+ss) among urban female (age 15+) has witnessed a decline to 6.4% in 2025 from 6.7% in 2024.
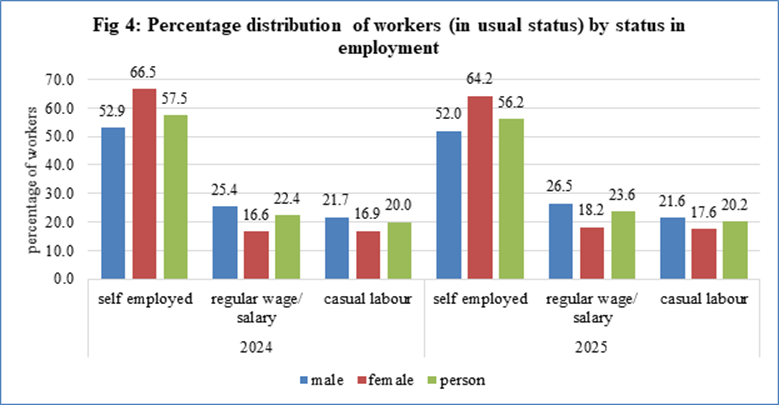
- Proportion of workers in regular wage/ salaried employment in usual status (ps+ss) increased to 23.6% in 2025 compared to 22.4% in 2024.
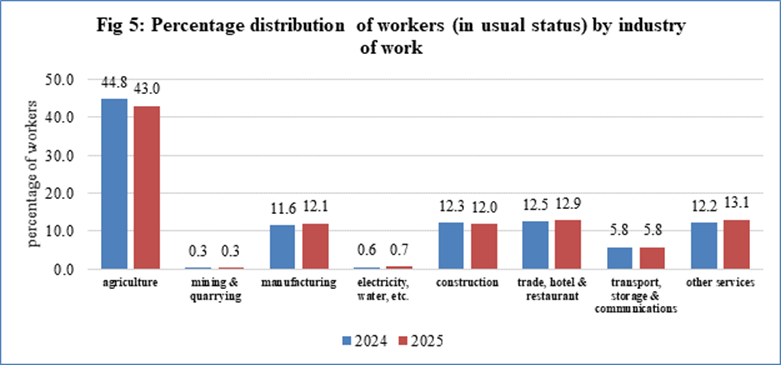
- Over the period, the manufacturing sector has broadly witnessed an increase in the proportion of workers engaged, while the agriculture sector has experienced a decline in the share of worker engagement.
- The growth in nominal wages of women engaged in self-employed, regular wage/ salaried employment and casual labour was 8.8%, 7.2% and 5.4%, respectively, from 2024 to 2025.
|
Key findings
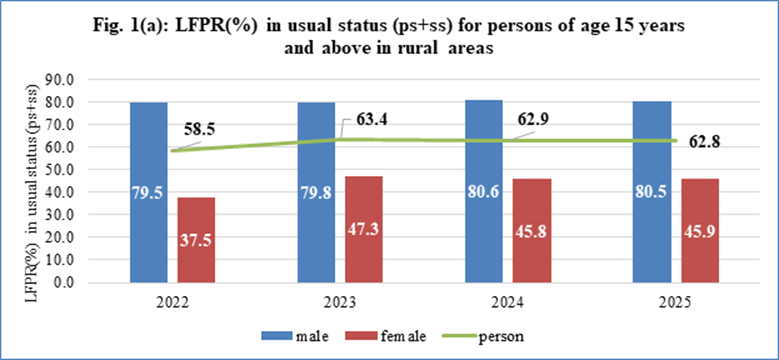
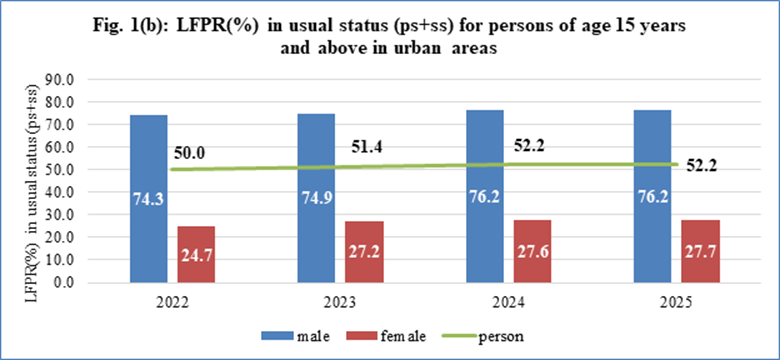
- Labour Force Participation Rate (LFPR) in usual status (ps+ss) for persons of age 15 years and above observed as 59.3% during 2025 and remained stable compared to 2024. The same for male and female stood at 79.1% and 40.0%, respectively, in 2025.
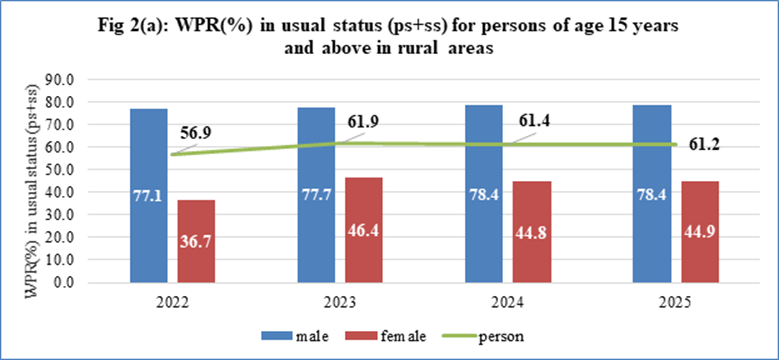
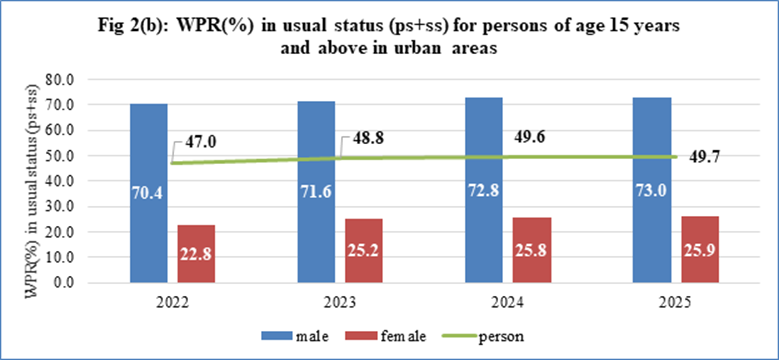
- Worker Population Ratio (WPR) in usual status (ps+ss) for persons of age 15 years and above estimated as 57.4% during 2025, remaining almost at the same level as in 2024. In 2025, the WPR for male and female was 76.6% and 38.8%, respectively.
- Among male, 69.8% reported want to continue studies as the main reason for not being in the labour force, whereas among female, 44.4% cited child care/personal commitments in home-making as the main reason.
- Among male aged 15 years and above, about 82.7% of those with a diploma/certificate, 79.1% of those with graduation and 83.1% of those with post-graduation and above as their highest level of education were in the workforce.
- The share of self-employed persons has shown a gradual decline from 2023 to 2025, decreasing from 58.2% in 2023 to 57.5% in 2024 and further to 56.2% in 2025.
- Urban self-employed male worked about 17.5 hours more per week than their female counterpart, while in rural areas the difference was around 12.3 hours per week. In regular wage/salaried employment and casual labour, male worked approximately 7.9 hours and 6.9 hours more per week, respectively, than female.
- Unemployment Rate (UR) in usual status (ps+ss) for persons aged 15 years and above was 3.1% for both male and female in 2025. For male, this represents a marginal decline from 3.3% in 2024, while for female, the rate remained unchanged.
- Youth (age 15-29 years) unemployment rate in usual status (ps+ss) declined to 9.9% in 2025 from 10.3% in 2024. The unemployment rate among rural youth decreased to 8.3% in 2025 from 8.7% in 2024, whereas among urban youth it fell to 13.6% from 14.3% over the same period.
- The unemployed persons cited apply to prospective employers/place or answer job advertisements/ check at factories, work sites followed by seek help from relatives, friends as the efforts mainly undertaken by them to search for work.
- The average number of years in formal education among persons with formal education in the age group 15 years and above and 25 years and above was estimated as 10.0 years and 9.8 years, respectively.
- In the age group 15 years and above, 67.8% persons were estimated to have at least secondary education. The same is 61.9% in rural areas and 79.7% in urban areas.
- Among persons aged 15-59 years, 4.2% reported having received /receiving formal vocational/ technical training. In the age group 15-29 years, the same is estimated as 5.0%.
- In the age group 15-59 years, 83.3% male and 51.4% female were in the workforce among those who received formal vocational/ technical training.
- In the usual status (ps+ss), 21.0% persons in the age group 15-24 years and 25.0% persons in the age group 15-29 years are estimated to be not in employment, education or training.
- Using the projected population figures of the Ministry of Health and Family Welfare (MoHFW), the absolute number of workers aged 15 years and above has been estimated. On average, 61.6 crore persons (aged 15 years and above) were employed, in usual status (ps+ss), in the country during January–December 2025, of which 41.6 crore were male and 20.0 crore were female.
Key Highligts of PLFS, Annual Report 2025
1. Stable Labour Force Participation Rate (LFPR) for persons of age 15 years and above
The rural male labour force participation remained strong at 80.5% while rural female participation held steady at 45.9%, sustaining the gains achieved in previous years. Both male and female labour force participation rates (based on usual status (ps+ss)) in 2025 remained broadly consistent with the levels observed in 2024 in urban areas.
2. Worker Population Ratio (WPR) for persons of age 15 years and above remains sustained
The WPR (according to usual status (ps+ss)) shows a broad stability in 2025 compared with 2024. In 2025, WPR for rural male remained robust at 78.4%, while WPR for rural female held steady at 44.9%, sustaining the significant gains made since 2022. The overall urban WPR maintained nearly at 50.0%.
3. Unemployment Rates (UR) reflect stability and improvement for persons of age 15 years and above
The UR estimates (in usual status (ps+ss)) indicate sustained progress in reducing unemployment across sectors and genders. Overall rural unemployment rates in 2025 stood at 2.4%, showing strong rural labour absorption. The female unemployment rate remained low at 2.1% lower than the male UR in rural areas which stood at 2.6%. The male and female unemployment eased to 4.2% and 6.4%, respectively in urban areas contributed marginal decrease in overall urban UR to 4.8%.
4. Increase in proportion of workers with regular wage/ salary employment
The percentage distribution of workers (in usual status) by status in employment indicates a modest shift in the composition of employment in 2025. The share of self-employment declined slightly from 57.5% in 2024 to 56.2% in 2025 at the overall level, with reductions observed for both male (52.9% to 52.0%) and female (66.5% to 64.2%). This moderation has been accompanied by an increase in the share of regular wage/salaried employment, which rose from 22.4% to 23.6%; the increase is visible for both male (25.4% to 26.5%) and female (16.6% to 18.2%). The share of workers engaged in casual labour has remained broadly stable at around one-fifth of total employment (20.0% in 2024 to 20.2% in 2025), with only marginal variations across gender.
5. Manufacturing and service sectors witnessed enhanced worker participation
The percentage distribution of workers (in usual status) by industry of work reflects a broadly stable sectoral composition in 2025 with some notable shifts. Agriculture continues to account for the largest share of employment, though it has decreased from 44.8% in 2024 to 43.0% in 2025. The share of employment in construction has decreased marginally (12.3% to 12.0%), while manufacturing has seen improvement from 11.6% to 12.1%. Other services have also recorded an increase (12.2% to 13.1%).
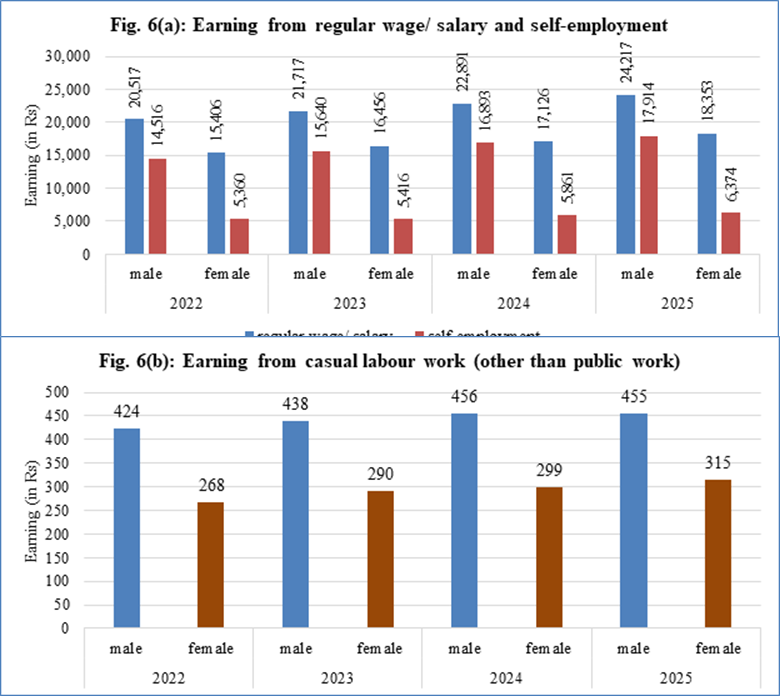
6. Earnings of female workers have seen a notable shift
Earnings of workers have shown a notable improvement in recent years across categories, with gains observed for both male and female in nominal terms. In regular wage/salaried employment, average earnings for male increased from ₹22,891 in 2024 to ₹24,217 in 2025 (about 5.8% growth), while for female, earnings rose from ₹17,126 to ₹18,353 (about 7.2% growth).
In self-employment, male earnings increased from ₹16,893 in 2024 to ₹17,914 in 2025 (around 6.0% growth), while female earnings rose from ₹5,861 to ₹6,374 (around 8.8% growth), reflecting stronger growth among female.
For casual labour (other than public works), male earnings remained stable (₹456 in 2024 and ₹455 in 2025), while female earnings improved from ₹299 to ₹315 (about 5.4% growth).
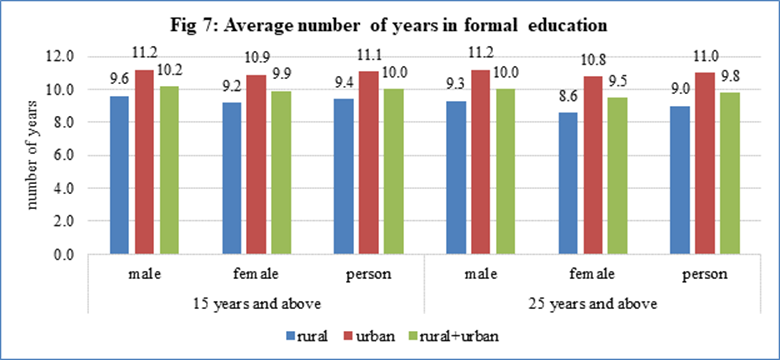
7. Average number of years in formal education
For persons aged 15 years and above, the average number of years in formal education stands at 10.0 years at the all-India level in 2025, with male at 10.2 years and female at 9.9 years. Urban areas reported higher average number of years in formal education (11.2 years for male and 10.9 years for female) compared to rural areas (9.6 years and 9.2 years, respectively).
A similar pattern is observed for persons aged 25 years and above, where the overall average is 9.8 years, with male at 10.0 years and female at 9.5 years in formal education. Urban attainment remains higher (11.2 years for male and 10.8 year for female), while rural levels stand at 9.3 years and 8.6 years, respectively.
Endnote: A brief about the objective, sample size, changes in sample design, conceptual framework and comparability of results of the Periodic Labour Force Survey (PLFS):
A. Introduction
Considering the need to generate high-frequency labour force indicators with enhanced coverage, the sampling methodology of the Periodic Labour Force Survey (PLFS) has been revamped from January 2025. Further, to keep uniformity with the international practice of reporting labour force indicators, the survey period of PLFS has been shifted from the July–June cycle (i.e., agricultural year) to the January–December cycle (i.e., calendar year) from 2025. The revamped PLFS design is envisaged to address the following objectives:
- to estimate the key employment and unemployment indicators (viz. Labour Force Participation Rate, Worker Population Ratio and Unemployment Rate) on a monthly basis for rural and urban areas in the Current Weekly Status (CWS) at all-India level
- to extend the coverage of the Quarterly results of PLFS to rural areas and thereby producing quarterly estimates covering both rural and urban areas of India in the Current Weekly Status (CWS)
- to estimate important employment and unemployment indicators in both usual status (ps+ss) and CWS for rural and urban areas annually
Seven Annual Reports based on Periodic Labour Force Survey (PLFS) covering both rural and urban areas, giving estimates of all important parameters of employment and unemployment in both usual status (ps+ss) and current weekly status (CWS) have been released. These seven Annual Reports are brought out based on data collected in PLFS during the survey period July 2017-June 2018, July 2018-June 2019, July 2019-June 2020, July 2020-June 2021, July 2021-June 2022, July 2022-June 2023 and July 2023-June 2024. Additionally, key employment and unemployment indicators for the calendar years 2021 to 2024 were also released at the all-India level.
Now the Annual Report, PLFS 2025, is being brought out by NSO as the first comprehensive report based on the calendar year (January 2025-December 2025) as the survey period.
B. Sample Size
Sample Size for First Visit during January 2025 – December 2025 in rural and urban areas for the Annual Report: Out of the total number of 22,692 FSUs (12,504 villages and 10,188 UFS blocks or sub units) allotted for the survey at the all-India level during January-December 2025, a total of 22,594 FSUs (12,441 villages and 10,153 urban blocks) were surveyed for canvassing the PLFS schedule (Schedule 10.4). The number of households surveyed was 2,70,472 (1,48,718 in rural areas and 1,21,754 in urban areas) and number of persons surveyed was 11,48,634 (6,56,160 in rural areas and 4,92,474 in urban areas). Among the persons surveyed, total number of persons of age 15 years and above was 8,91,266 (4,96,186 in rural areas and 3,95,080 in urban areas).
C. Changes in Sample Design of PLFS
To achieve the objectives, the sampling design of PLFS has been revised with effect from January 2025. The revamped design has been introduced to enhance the frequency and representativeness of key labour market indicators. The salient features of the revised sampling design, as adopted from January 2025, are presented below:
- From January 2025, the revamped design covers both rural and urban sectors, with four consecutive monthly visits following a rotational panel scheme. This ensures 75% matching of samples surveyed between consecutive months and 50% matching across successive quarters.
- To ensure uniformity in FSU size, large villages and UFS blocks are divided into smaller units of more or less equal size, known as sub-units based on population/households. The sampling frame now consists of the list of census villages/sub-units in rural areas and UFS blocks/sub-units in urban areas.
- Districts are treated as basic strata, separately for rural and urban sectors, for selecting FSUs for most part of the geography covered with NSS regions. In the remaining parts NSS region has been made the basic stratum. Additional stratification is introduced based on distance from district headquarters/cities and for large urban centres, improving geographical representation.
- FSUs are selected using Simple Random Sampling (SRS), with one FSU drawn per stratum/sub-stratum each month and no provision for independent sub-samples.
- Up to December 2024, PLFS covered an average 12,800 FSUs (7,016 rural and 5,784 urban) with 8 households per FSU, implying an overall sample size of around 1.02 lakh households. From January 2025, the sample size increased to 22,692 FSUs (12,504 rural and 10,188 urban) with 12 households per FSU, covering about 2.72 lakh households, around 2.65 times higher than earlier.
The details of the revamped PLFS sample design have been provided in the PLFS release titled PLFS: Changes in 2025
(https://www.mospi.gov.in/sites/default/files/publication_reports/PLFS_Changes-in-2025_rev.pdf ).
D. Conceptual Framework of Key Indicators
The Periodic Labour Force Survey (PLFS) gives estimates of Key employment and unemployment Indicators like Labour Force Participation Rates (LFPR), Worker Population Ratio (WPR), Unemployment Rate (UR), etc. These indicators, and the ‘Usual Status’ and ‘Current Weekly Status’ are defined as follows:
- Labour Force Participation Rate (LFPR): LFPR is defined as the percentage of persons in labour force (i.e. working or seeking or available for work) in the population.
- Worker Population Ratio (WPR): WPR is defined as the percentage of employed persons in the population.
- Unemployment Rate (UR): UR is defined as the percentage of persons unemployed among the persons in the labour force.
- Activity Status - Usual Status: The activity status of a person is determined on the basis of the activities pursued by the person during the specified reference period. When the activity status is determined on the basis of the reference period of last 365 days preceding the date of survey, it is known as the usual activity status of the person.
- Principal activity status (ps): The activity status on which a person spent relatively long time (major time criterion) during 365 days preceding the date of survey, was considered the usual principal activity status of the person.
- Subsidiary economic activity status (ss): The activity status in which a person in addition to his/her usual principal status, performs some economic activity for 30 days or more for the reference period of 365 days preceding the date of survey, was considered the subsidiary economic activity status of the person.
- Activity Status - Current Weekly Status (CWS): The activity status determined on the basis of a reference period of last 7 days preceding the date of survey is known as the current weekly status (CWS) of the person.
E. Compatibility of PLFS 2025 results
From 2025, the sampling design of the Periodic Labour Force Survey (PLFS) has been modified with the objective of generating high-frequency estimates of key labour force indicators. The revised design involves changes in sample allocation, sample selection and rotational panel to support the production of high-frequency estimates. As a result of these methodological changes, the annual estimates presented in this report are derived from a sampling framework that differs from that used in earlier PLFS annual estimates. Although the concepts, definitions and coverage of labour force indicators remain broadly unchanged, the change in sampling design and estimation procedure may influence the level of the estimates. Consequently, the annual estimates for 2025 may not be strictly comparable with those presented in the previous annual reports of the Periodic Labour Force Survey or calendar year-wise results derived from unit-level data for the years 2022 to 2024 presented in the report. Users of PLFS results need to consider the changes implemented in PLFS from January 2025 while comparing PLFS results with estimates released through PLFS publications up to December 2024. The results of the PLFS post-January 2025 thus need to be understood and used in the context in which the PLFS sample selection methodology was designed.
E. Detailed tables included in the Annual Report
***
Samrat
(रिलीज़ आईडी: 2246009)
आगंतुक पटल : 57024
इस विज्ञप्ति को इन भाषाओं में पढ़ें:
हिन्दी