Ministry of Commerce & Industry
The cumulative exports (merchandise & services) during FY 2025-26 (April-March) is estimated at US$ 860.09 Billion, as compared to US$ 825.26 Billion in FY 2024-25 (April-March), an estimated growth of 4.22%.
The cumulative value of merchandise exports during FY 2025-26 (April-March) was US$ 441.78 Billion, as compared to US$ 437.70 Billion during FY 2024-25 (April-March), registering a positive growth of 0.93%.
The cumulative Non-Petroleum exports in FY 2025-26 (April-March) valued at US$ 387.88 Billion registered an increase of 3.62% as compared to US$ 374.32 Billion in FY 2024-25 (April-March).
Major drivers of merchandise exports growth in March 2026 include Petroleum Products, Engineering Goods, Mica, Coal & Other Ores, Minerals including processed minerals, Other cereals and Handicrafts excl. hand made carpet.
Petroleum Products exports increased by 5.88 % from US$ 4.90 Billion in March 2025 to US$ 5.18 Billion in March 2026.
Engineering Goods exports increased by 1.13 % from US$ 10.82 Billion in March 2025 to US$ 10.94 Billion in March 2026.
Mica, Coal & Other Ores, Minerals including processed minerals exports increased by 11.27 % from US$ 0.52 Billion in March 2025 to US$ 0.58 Billion in March 2026.
Other cereals exports increased by 108.23 % from US$ 0.03 Billion in March 2025 to US$ 0.06 Billion in March 2026.
Handicrafts excl. hand made carpet exports increased by 8.51 % from US$ 0.13 Billion in March 2025 to US$ 0.14 Billion in March 2026.
Posted On:
15 APR 2026 5:06PM by PIB Delhi
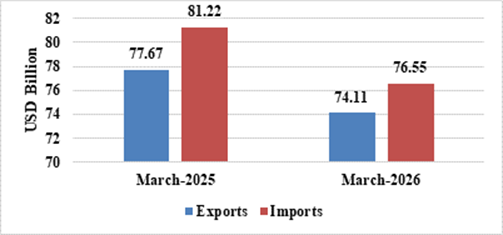
- India’s total exports (Merchandise and Services combined) for March 2026* is estimated at US$ 74.11 Billion, registering a negative growth of (-) 4.58 percent vis-à-vis March 2025. Total imports (Merchandise and Services combined) for March 2026* is estimated at US$ 76.55 Billion, registering a negative growth of (-) 5.76 percent vis-à-vis March 2025.
Table 1: Trade during March 2026*
|
|
|
March 2026
(US$ Billion)
|
March 2025
(US$ Billion)
|
|
Merchandise
|
Exports
|
38.92
|
42.05
|
|
Imports
|
59.59
|
63.74
|
|
Services*
|
Exports
|
35.20
|
35.63
|
|
Imports
|
16.96
|
17.48
|
|
Total Trade
(Merchandise +Services) *
|
Exports
|
74.11
|
77.67
|
|
Imports
|
76.55
|
81.22
|
|
Trade Balance
|
-2.44
|
-3.55
|
* Note: The latest data for services sector released by RBI is for February 2026. The data for March 2026 is an estimation. (ii) Data for FY 2024-25 (April-March) and April-December 2025 has been revised on pro-rata basis using quarterly balance of payments data.
Fig 1: Total Trade during March 2026*
- India’s total exports during FY 2025-26 (April-March)* is estimated at US$ 860.09 Billion registering a positive growth of 4.22 percent. Total imports during FY 2025-26 (April-March)* is estimated at US$ 979.40 Billion registering a growth of 6.47 percent.
Table 2: Trade during FY 2025-26 (April-March)*
|
|
|
FY 2025-26
(US$ Billion)
|
FY 2024-25
(US$ Billion)
|
|
Merchandise
|
Exports
|
441.78
|
437.70
|
|
Imports
|
774.98
|
721.20
|
|
Services*
|
Exports
|
418.31
|
387.55
|
|
Imports
|
204.42
|
198.72
|
|
Total Trade
(Merchandise +Services) *
|
Exports
|
860.09
|
825.26
|
|
Imports
|
979.40
|
919.92
|
|
Trade Balance
|
-119.30
|
-94.66
|
Fig 2: Total Trade during FY 2025-26 (April-March)*

MERCHANDISE TRADE
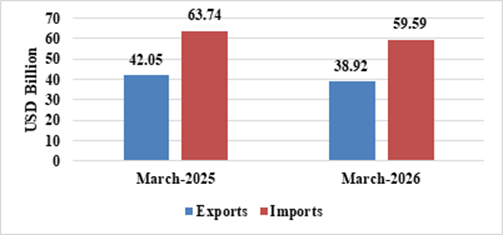
- Merchandise exports during March 2026 were US$ 38.92 Billion as compared to US$ 42.05 Billion in March 2025.
- Merchandise imports during March 2026 were US$ 59.59 Billion as compared to US$ 63.74 Billion in March 2025.
Fig 3: Merchandise Trade during March 2026
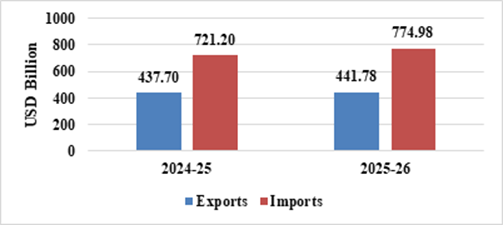
- Merchandise exports during FY 2025-26 (April-March) were US$ 441.78 Billion as compared to US$ 437.70 Billion during FY 2024-25 (April-March).
- Merchandise imports during FY 2025-26 (April-March) were US$ 774.98 Billion as compared to US$ 721.20 Billion during FY 2024-25 (April-March).
- Merchandise trade deficit during FY 2025-26 (April-March) was US$ 333.19 Billion as compared to US$ 283.50 Billion during FY 2024-25 (April-March).
Fig 4: Merchandise Trade during FY 2025-26 (April-March)
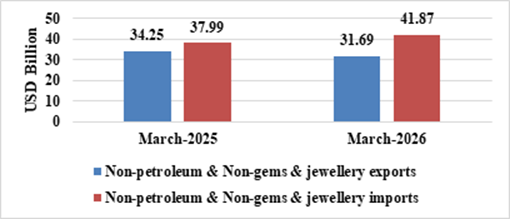
- Non-petroleum and non-gems & jewellery exports in March 2026 were US$ 31.69 Billion compared to US$ 34.25 Billion in March 2025.
- Non-petroleum, non-gems & jewellery (gold, silver & precious metals) imports in March 2026 were US$ 41.87 Billion compared to US$ 37.99 Billion in March 2025.
Table 3: Trade excluding Petroleum and Gems & Jewellery during March 2026
|
|
March 2026
(US$ Billion)
|
March 2025 (US$ Billion)
|
|
Non- petroleum exports
|
33.74
|
37.15
|
|
Non- petroleum imports
|
47.41
|
44.73
|
|
Non-petroleum & Non-Gems & Jewellery exports
|
31.69
|
34.25
|
|
Non-petroleum & Non-Gems & Jewellery imports
|
41.87
|
37.99
|
Note: Gems & Jewellery Imports include Gold, Silver & Pearls, precious & Semi-precious stones
Fig 5: Trade excluding Petroleum and Gems & Jewellery during March 2026
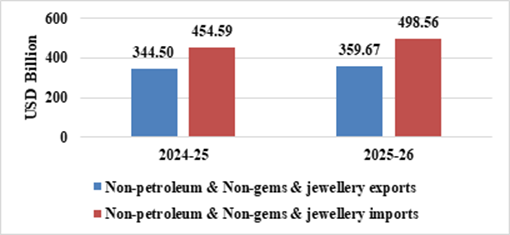
- Non-petroleum and non-gems & jewellery exports in FY 2025-26 (April-March) were US$ 359.67 Billion, compared to US$ 344.50 Billion in FY 2024-25 (April-March).
- Non-petroleum, non-gems & jewellery (gold, silver & precious metals) imports in FY 2025-26 (April-March) were US$ 498.56 Billion, compared to US$ 454.59 Billion in FY 2024-25 (April-March).
Table 4: Trade excluding Petroleum and Gems & Jewellery during FY 2025-26 (April-March)
|
|
FY 2025-26
(US$ Billion)
|
FY 2024-25
(US$ Billion)
|
|
Non- petroleum exports
|
387.88
|
374.32
|
|
Non- petroleum imports
|
601.03
|
535.42
|
|
Non-petroleum & Non Gems & Jewellery exports
|
359.67
|
344.50
|
|
Non-petroleum & Non Gems & Jewellery imports
|
498.56
|
454.59
|
Note: Gems & Jewellery Imports include Gold, Silver & Pearls, precious & Semi-precious stones
Fig 6: Trade excluding Petroleum and Gems & Jewellery during FY 2025-26 (April-March)
SERVICES TRADE
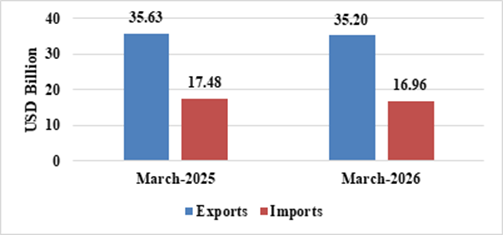
- The estimated value of services export for March 2026* is US$ 35.20 Billion as compared to US$ 35.63 Billion in March 2025.
- The estimated value of services imports for March 2026* is US$ 16.96 Billion as compared to US$ 17.48 Billion in March 2025.
Fig 7: Services Trade during March 2026*
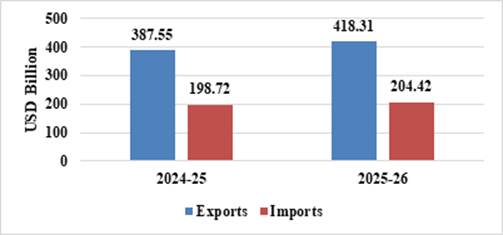
- The estimated value of service exports during FY 2025-26 (April-March)* is US$ 418.31 Billion as compared to US$ 387.55 Billion in FY 2024-25 (April-March).
- The estimated value of service imports during FY 2025-26 (April-March)* is US$ 204.42 Billion as compared to US$ 198.72 Billion in FY 2024-25 (April-March).
- The services trade surplus for FY 2025-26 (April-March)* is US$ 213.89 Billion as compared to US$ 188.84 Billion in FY 2024-25 (April-March).
Fig 8: Services Trade during FY 2025-26 (April-March)*
- Exports of Other Cereals (108.23%), Mica, Coal & Other Ores, Minerals Including Processed Minerals (11.27%), Handicrafts Excl. Hand Made Carpet (8.51%), Petroleum Products (5.88%), Engineering Goods (1.13%) and Marine Products (0.76%) record positive growth during March 2026 over the corresponding month of last year.
- Imports of Petroleum, Crude & Products (-35.91%), Gold (-31.63%), Cotton Raw & Waste (-30.38%), Project Goods (-23.7%), Pulses (-21.81%), Pulp And Waste Paper (-19.11%), Chemical Material & Products (-18.43%), Iron & Steel (-14.21%), Transport Equipment (-13.7%), Pearls, Precious & Semi-Precious Stones (-13.15%), Wood & Wood Products (-8.02%), Organic & Inorganic Chemicals (-6.4%), Artificial Resins, Plastic Materials, Etc. (-2.98%) and Newsprint (-2.22%) record negative growth during March 2026 over the corresponding month of last year.
- Services exports is estimated to grow by 7.94 percent during FY 2025-26 (April-March)* over FY 2024-25 (April-March).
- Top 5 export destinations, in terms of change in value, exhibiting positive growth in March 2026 vis a vis March 2025 are Singapore (158.55%), Malaysia (84.47%), China P Rp (28.1%), Tanzania Rep (100.54%) & Sri Lanka Dsr (88.31%).
- Top 5 export destinations, in terms of change in value, exhibiting positive growth in FY 2025-26 (April-March) vis a vis FY 2024-25 (April-March) are China P Rp (36.66%), Spain (46.33%), Hong Kong (33.22%), Vietnam Soc Rep (22.78%) & Sri Lanka Dsr (21.14%).
- Top 5 import sources, in terms of change in value, exhibiting growth in March 2026 vis a vis March 2025 are China P Rp (24.81%), Thailand (64.53%), Peru (267.67%), Oman (112.01%) & U S A (14.4%).
- Top 5 import sources, in terms of change in value, exhibiting growth in FY 2025-26 (April-March) vis a vis FY 2024-25 (April-March) are China P Rp (16.03%), U S A (15.95%), Hong Kong (23.32%), Peru (78.08%) & U K (36.09%).
Link for Quick Estimates:
***
Abhishek Dayal/Shabbir Azad/Anushka Pandey
(Release ID: 2252272)
Visitor Counter : 25948