Ministry of Statistics & Programme Implementation
Launch of Integrated Dashboard for Performance Monitoring of Infrastructure Sector in India
Stepping towards Infrastructure excellence with enhanced performance monitoring of infrastructure sub-sectors through PAIMANA
Posted On:
16 APR 2026 4:00PM by PIB Delhi
The Ministry of Statistics and Programme Implementation (MoSPI) operationalised PAIMANA (Project Assessment, Infrastructure Monitoring & Analytics for Nation-building) on 25th September 2025 for the mandated monitoring of Central Sector Infrastructure Projects replacing the erstwhile OCMS-2006 (Online Computerized Monitoring system). To further strengthen the efforts towards infrastructure monitoring, MoSPI has launched a Performance Monitoring Dashboard for tracking infrastructure performance across key sub-sectors, marking a significant step towards strengthening data-driven governance and evidence-based policymaking in the country.
2. Key Features of the Revamped Framework of Infrastructure Performance Monitoring
- MoSPI has been monitoring infrastructure performance across 11 key sectors covering 28 sub-indicators, including power, roads, railways, civil aviation, telecommunications and ports. The existing framework assesses sectoral performance based on growth rates (year-on-year, month-on-month and cumulative), achievement against targets & capacity utilisation in select sectors.
- The revamped approach marks a shift from measuring sectoral outputs (production) to assessing multi-dimensional infrastructure performance across the dimensions of access: which measure how widely infrastructure is available; quality: which assess its usefulness and reliability; fiscal cost & revenue: which assess allocation and use of financial resources for infrastructure; utilization: evaluate how efficiently infrastructure is used for its defined purpose; affordability: determine whether it is economically accessible to people. The above categorisation of indicators improves analysis by moving beyond simple output tracking to a more holistic evaluation of infrastructure performance across multiple dimensions enabling informed policy decisions and targeted interventions.
- At present, 116 indicators are available on the performance monitoring dashboard.
|
S. No
|
Infrastructure sub-sector
|
Dashboard Indicators
|
|
1
|
Civil Aviation
|
29
|
|
2
|
Roads
|
9
|
|
3
|
Power
|
13
|
|
4
|
Ports, Shipping & Waterways
|
49
|
|
5
|
Telecommunications
|
7
|
|
6
|
Railways
|
9
|
|
Total
|
116
|
3. Key Highlights:
- Civil Aviation: In FY 2025–26 (up to September), passenger traffic reached 20.2 crore (2.6% YoY) and cargo handled stood at 19.8 lakh tonnes (4.6% YoY), reflecting sustained demand. Capacity utilisation remained healthy, with Passenger Load Factor at 81.8% and Weight Load Factor at 75.6%, indicating continued operational recovery.
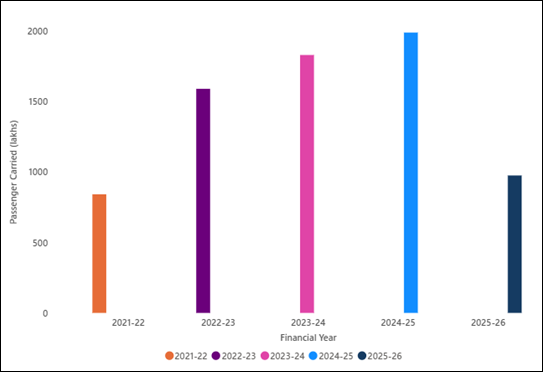
Passengers handled at airports from FY 2021-22 onwards (FY 2025-26: As on 30/09/2025)
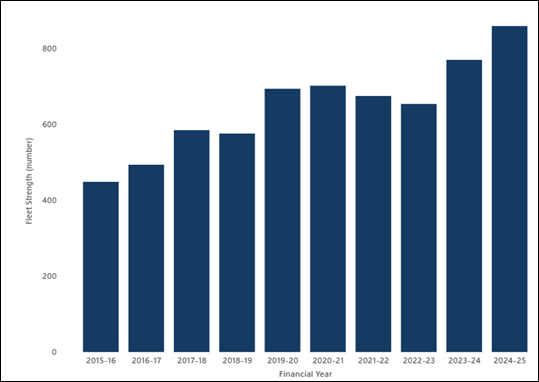
Fleet Strength of all Scheduled Indian Operators from FY 2015-16 onwards
- Power: Capacity utilisation remained robust for FY 2024-25, with Plant Load Factor at 69.5% (thermal) and 79.1% (nuclear), while captive generation stood at 2,32,629 GWh (3.9% YoY). Grid reliability stayed strong, with peak demand of 23,01,708.6 MW in FY 2025–26 (up to January) almost fully met, with only a 0.03% deficit.
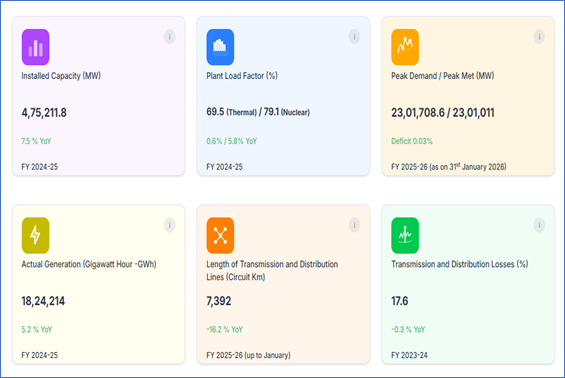
Dashboard Overview for Power sub-sector
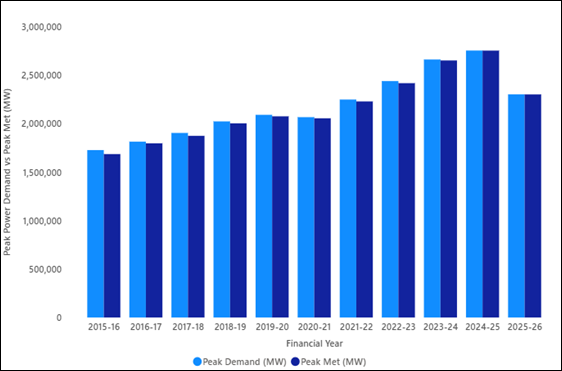
Peak Power Demand vs Peak Met from FY 2015-16 onwards (FY 2025-26: As on 28/02/2026)
- Telecommunication: Network infrastructure strengthened with 8.48 lakh telecom towers (2.9% YoY), while tele-density improved to 91.7 (7.8% YoY), indicating deeper telecom penetration and wider digital access.
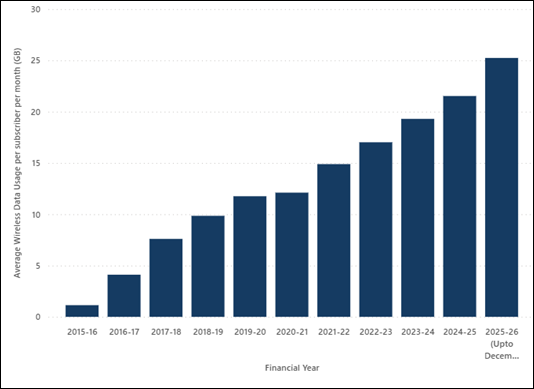
Average wireless data usage per subscriber per month from FY 2015-16 onwards (FY 2025-26: As on 31/12/2025)
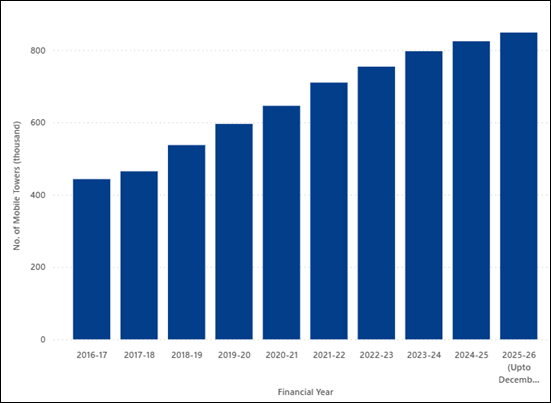
Number of Telecom Towers from FY 2016-17 onwards (FY 2025-26: As on 31/12/2025)
- Road Transport and Highways sector: Digital tolling also strengthened, with 114.4 lakh FASTags issued and electronic toll collection transactions rising to 282.5 crore (13.3% YoY), indicating wider adoption of cashless toll systems.
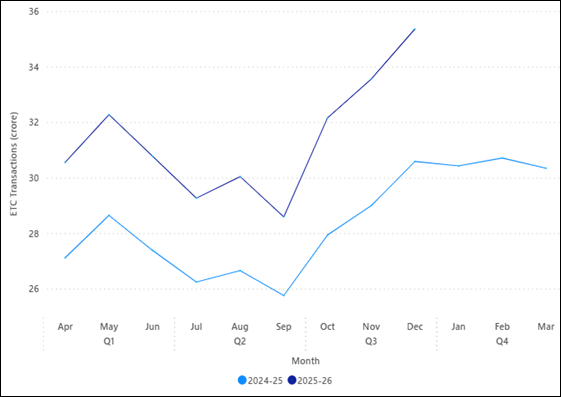
Electronic Toll Transactions - FY 2024-25 vs FY 2025-26 (FY 2025-26: Up to Q3)
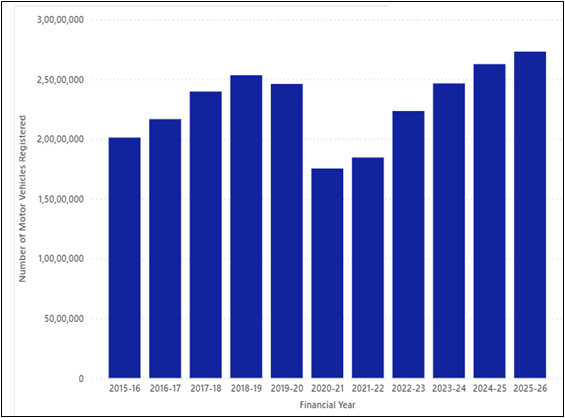
Number of Motor Vehicles Registered from FY 2015-16 onwards (FY 2025-26: As on 31/12/2025)
- Railways sector: Passenger operations sustained recovery, with passenger train kilometres rising to 835 million km (4.4% YoY), while the punctuality index for Mail/Express trains improved to 77.1% (4.8% YoY), indicating better efficiency and reliability.
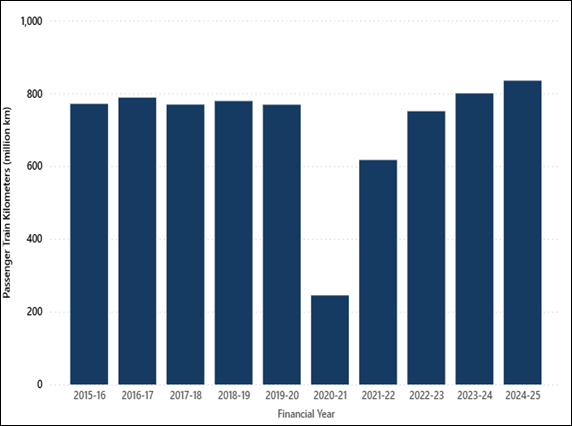
Passenger Train Kilometers from FY 2015-16 onwards
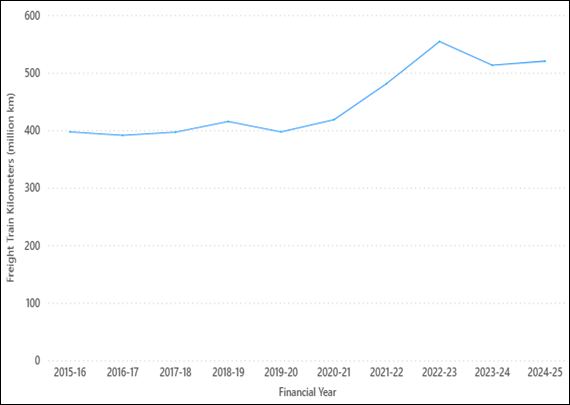
Freight Train Kilometers since FY 2015-16 onwards
- Ports, Shipping & Waterways sector: India’s fleet rose to 1,545 vessels (1.2% YoY) in FY 2023–24. Inland water transport also strengthened, with waterways length reaching 29,267 km (4.2% YoY), supporting better multimodal connectivity.
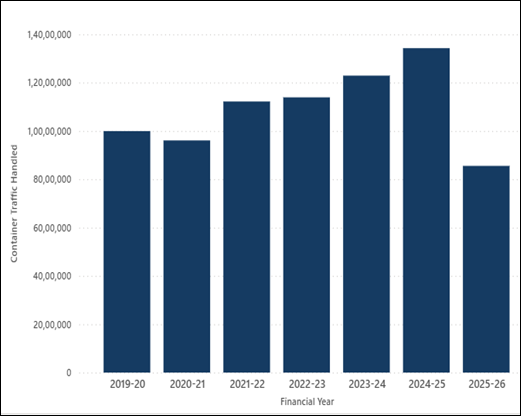
Container traffic handled at Non-major ports from FY 2015-16 onwards (FY 2025-26: As on 30/10/2025)
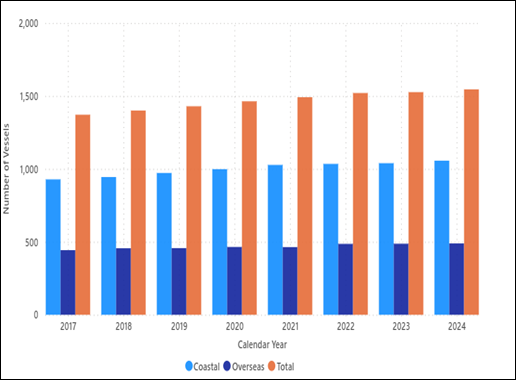
Number of vessels basis route type from calendar year 2017 onwards
4. The launch of the revamped Performance Monitoring Dashboard represents a major step towards enhancing transparency, efficiency, and accountability in infrastructure monitoring. By leveraging technology and developing a comprehensive indicator framework, MoSPI aims to support sustainable and inclusive infrastructure development in the country.
5. Next date of Press Release: Dashboards for Performance Monitoring will be updated on a quarterly basis. Next update would be on 16th July 2026.
Note: The press release summarizes highlights from the newly launched MoSPI’s performance monitoring dashboard, available at https://paimana-perf.mospi.gov.in or via the QR code

*****
Samrat/Pranab
(Release ID: 2252587)
Visitor Counter : 1819