Election Commission
General Elections to Legislative Assemblies and bye-elections 2026
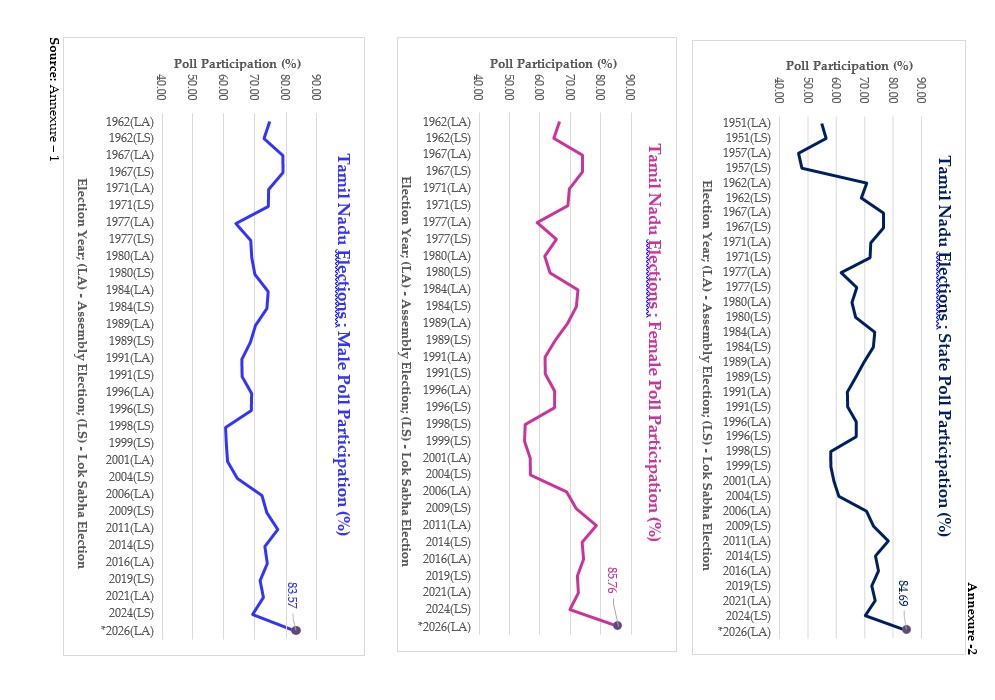
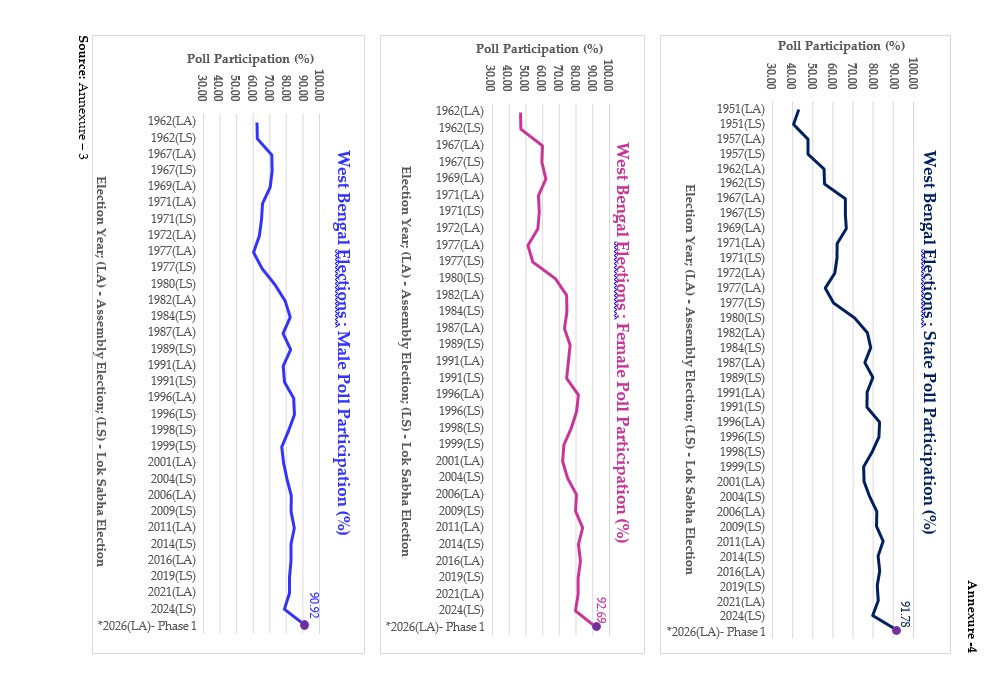
Tamil Nadu (84.69%) and West Bengal (Phase-I) (91.78%) record highest-ever poll participation since Independence
Posted On:
23 APR 2026 8:38PM by PIB Delhi
1. Polling for the General Elections for the Legislative Assemblies of Tamil Nadu and West Bengal (Phase-I) and the bye-elections in 3 ACs of 2 States (Gujarat and Maharashtra) began today at 7:00 AM.
2. Tamil Nadu with 84.69% and West Bengal (Phase-I) with 91.78% recorded the highest- ever poll-participation since Independence. Previously, the highest poll-participation in Tamil Nadu was 78.29% (2011 GELA) and in West Bengal was 84.72% (2011 GELA) respectively. Details of previous poll participation figures are annexed.
3. Details of poll participation (%) are as follows:
|
State/UT
|
Poll Percentage (%)
|
|
Male
|
Female
|
3rd Gender
|
Total
|
|
General Elections to Legislative Assembly
|
|
Tamil Nadu
|
83.57
|
85.76
|
60.49
|
84.69
|
|
West Bengal (Ph-I)
|
90.92
|
92.69
|
56.79
|
91.78
|
|
Bye-elections to AC
|
|
Gujarat
1. Umreth-111
|
61.52
|
56.34
|
50.00
|
59.03
|
|
Maharashtra
1. Baramati-201
|
61.61
|
53.29
|
4.48
|
57.48
|
|
2. Rahuri-223
|
58.59
|
51.80
|
0.00
|
55.31
|
*As per data uploaded by the PROs themselves in ECINET. Data from 6,345 PS in WB and 6,411 PS in TN yet to be updated
+Data is provisional and it does not include Service Voters & Postal Ballots. Final figures will be shared in Index Cards through ECINET
4. Chief Election Commissioner Shri Gyanesh Kumar, along with Election Commissioners Dr.
S.S. Sandhu and Dr. Vivek Joshi kept a close watch on the polling through live webcasting
which was ensured in 100% of the Polling Stations in both the states.
5. Details of electorate, polling stations, polling staff, candidates and polling agents in the two states are as under:
|
State
|
ACs
|
Electorate
|
No. of PS
|
Polling Staff
|
Candid ates
|
Polling Agents
|
|
Male
(in Crores)
|
Female
(in Crores)
|
3rd
Gender
|
Total
(in Crores)
|
|
Tamil Nadu
|
234
|
2.80
|
2.93
|
7,728
|
5.73
|
75,064
|
3,75,320
|
4,023
|
4,21,328
|
|
West Bengal (Ph-I)
|
152
|
1.84
|
1.76
|
465
|
3.60
|
44,376
|
2,21,880
|
1,478
|
1,54,222
|
|
TOTAL
|
386
|
4.64
|
4.69
|
8,193
|
9.33
|
1,19,440
|
5,97,200
|
5,501
|
5,75,550
|
6. Presiding Officers updated the polling percentage on ECINET at the close of poll before leaving the polling station as per ECI’s latest instructions resulting in minimal delay in updation of the polling trends.
7. Several new voter-friendly initiatives such as easily identifiable colour photos of candidates on EVM ballot papers, Mobile Deposit Facility (MDF), newly designed Voter Information Slips (VIS) for easy readability and limit of electors upto 1,200 per polling station were ensured in these elections.
8. Polling stations were also provided with wheelchairs and volunteers to assist PwD voters. Transport facility was also provided to assist PwD voters in reaching their respective polling stations.
9. District-wise and AC wise approximate voter turnout figures are available on the ECINET App.
**********
PK/GDH/RP
Annexure -1
Tamil Nadu: Gender-wise Poll Participation in Elections [1951 – 2026]
|
Sl.
No.
|
State
|
Type
|
Year of Election
|
Male VTR
%
|
Female VTR %
|
Total VTR
%
|
|
[Excl. Postal votes]
|
|
1
|
Madras
|
LA
|
1951
|
|
54.75
|
|
2
|
Madras
|
LS
|
1951
|
56.33
|
|
3
|
Madras
|
LA
|
1957
|
46.56
|
|
4
|
Madras
|
LS
|
1957
|
47.75
|
|
5
|
Madras
|
LA
|
1962
|
74.92
|
66.45
|
70.65
|
|
6
|
Madras
|
LS
|
1962
|
73.07
|
64.55
|
68.77
|
|
7
|
Madras
|
LA
|
1967
|
79.19
|
73.99
|
76.57
|
|
8
|
Madras
|
LS
|
1967
|
79.23
|
73.94
|
76.56
|
|
9
|
Tamil Nadu
|
LA
|
1971
|
74.55
|
69.66
|
72.10
|
|
10
|
Tamil Nadu
|
LS
|
1971
|
74.48
|
69.17
|
71.82
|
|
11
|
Tamil Nadu
|
LA
|
1977
|
64.02
|
59.08
|
61.58
|
|
12
|
Tamil Nadu
|
LS
|
1977
|
68.81
|
65.43
|
67.13
|
|
13
|
Tamil Nadu
|
LA
|
1980
|
69.14
|
61.61
|
65.42
|
|
14
|
Tamil Nadu
|
LS
|
1980
|
70.15
|
63.34
|
66.76
|
|
15
|
Tamil Nadu
|
LA
|
1984
|
74.42
|
72.49
|
73.47
|
|
16
|
Tamil Nadu
|
LS
|
1984
|
74.00
|
71.94
|
72.98
|
|
17
|
Tamil Nadu
|
LA
|
1989
|
70.33
|
69.02
|
69.69
|
|
18
|
Tamil Nadu
|
LS
|
1989
|
68.67
|
65.01
|
66.86
|
|
19
|
Tamil Nadu
|
LA
|
1991
|
65.94
|
61.69
|
63.84
|
|
20
|
Tamil Nadu
|
LS
|
1991
|
66.02
|
61.76
|
63.92
|
|
21
|
Tamil Nadu
|
LA
|
1996
|
69.08
|
64.78
|
66.95
|
|
22
|
Tamil Nadu
|
LS
|
1996
|
68.99
|
64.85
|
66.93
|
|
23
|
Tamil Nadu
|
LS
|
1998
|
60.67
|
55.19
|
57.95
|
|
24
|
Tamil Nadu
|
LS
|
1999
|
60.96
|
54.96
|
57.98
|
|
25
|
Tamil Nadu
|
LA
|
2001
|
61.30
|
56.83
|
59.07
|
|
26
|
Tamil Nadu
|
LS
|
2004
|
64.49
|
56.89
|
60.81
|
|
27
|
Tamil Nadu
|
LA
|
2006
|
72.41
|
68.75
|
70.56
|
|
28
|
Tamil Nadu
|
LS
|
2009
|
73.95
|
71.91
|
73.05
|
|
29
|
Tamil Nadu
|
LA
|
2011
|
77.53
|
78.51
|
78.29
|
|
30
|
Tamil Nadu
|
LS
|
2014
|
73.35
|
73.83
|
73.74
|
|
31
|
Tamil Nadu
|
LA
|
2016
|
74.16
|
74.33
|
74.81
|
|
32
|
Tamil Nadu
|
LS
|
2019
|
71.81
|
72.29
|
72.44
|
|
33
|
Tamil Nadu
|
LA
|
2021
|
72.88
|
72.61
|
73.63
|
|
34
|
Tamil Nadu
|
LS
|
2024
|
69.43
|
69.86
|
70.14
|
|
35
|
Tamil Nadu
|
LA
|
2026*
|
83.57
|
85.76
|
84.69
|
*As per data uploaded by the PROs themselves in ECINET. Data from 6,411 PS in TN yet to be updated throughECINET
Annexure -3
West Bengal: Gender-wise Poll Participation in Elections [1951 – 2026]
|
Sl.
No.
|
State
|
Year of Election
|
Election Type
|
Male VTR
%
|
Female VTR %
|
Total VTR
%
|
|
[Excl. Postal votes]
|
|
1
|
West Bengal
|
1951
|
LA
|
|
43.12
|
|
2
|
West Bengal
|
1951
|
LS
|
40.49
|
|
3
|
West Bengal
|
1957
|
LA
|
47.64
|
|
4
|
West Bengal
|
1957
|
LS
|
47.67
|
|
5
|
West Bengal
|
1962
|
LA
|
61.77
|
47.43
|
55.55
|
|
6
|
West Bengal
|
1962
|
LS
|
61.98
|
47.62
|
55.75
|
|
7
|
West Bengal
|
1967
|
LA
|
70.69
|
60.51
|
66.10
|
|
8
|
West Bengal
|
1967
|
LS
|
70.88
|
60.15
|
66.03
|
|
9
|
West Bengal
|
1969
|
LA
|
69.67
|
62.57
|
66.51
|
|
10
|
West Bengal
|
1971
|
LA
|
65.09
|
58.09
|
62.03
|
|
11
|
West Bengal
|
1971
|
LS
|
64.51
|
58.57
|
61.93
|
|
12
|
West Bengal
|
1972
|
LA
|
63.19
|
57.75
|
60.82
|
|
13
|
West Bengal
|
1977
|
LA
|
59.72
|
51.86
|
56.15
|
|
14
|
West Bengal
|
1977
|
LS
|
64.86
|
54.75
|
60.24
|
|
15
|
West Bengal
|
1980
|
LS
|
72.58
|
68.18
|
70.62
|
|
16
|
West Bengal
|
1982
|
LA
|
78.79
|
74.87
|
76.96
|
|
17
|
West Bengal
|
1984
|
LS
|
81.74
|
75.04
|
78.61
|
|
18
|
West Bengal
|
1987
|
LA
|
77.42
|
73.65
|
75.66
|
|
19
|
West Bengal
|
1989
|
LS
|
82.05
|
76.92
|
79.67
|
|
20
|
West Bengal
|
1991
|
LA
|
77.53
|
75.96
|
76.80
|
|
21
|
West Bengal
|
1991
|
LS
|
78.33
|
74.88
|
76.73
|
|
22
|
West Bengal
|
1996
|
LA
|
83.86
|
81.92
|
82.94
|
|
23
|
West Bengal
|
1996
|
LS
|
84.27
|
80.86
|
82.66
|
|
24
|
West Bengal
|
1998
|
LS
|
80.73
|
77.66
|
79.27
|
|
25
|
West Bengal
|
1999
|
LS
|
76.70
|
73.25
|
75.05
|
|
26
|
West Bengal
|
2001
|
LA
|
77.83
|
72.53
|
75.29
|
|
27
|
West Bengal
|
2004
|
LS
|
79.86
|
75.38
|
78.04
|
|
28
|
West Bengal
|
2006
|
LA
|
82.34
|
80.75
|
81.58
|
|
29
|
West Bengal
|
2009
|
LS
|
82.29
|
80.25
|
81.42
|
|
30
|
West Bengal
|
2011
|
LA
|
84.22
|
84.45
|
84.72
|
|
31
|
West Bengal
|
2014
|
LS
|
82.19
|
81.96
|
82.22
|
|
32
|
West Bengal
|
2016
|
LA
|
82.23
|
83.13
|
83.02
|
|
33
|
West Bengal
|
2019
|
LS
|
81.35
|
81.79
|
81.76
|
|
34
|
West Bengal
|
2021
|
LA
|
81.37
|
81.75
|
82.30
|
|
35
|
West Bengal
|
2024
|
LS
|
78.20
|
80.16
|
79.55
|
|
36
|
West Bengal
|
2026 [Phase -1]*
|
LA
|
90.92
|
92.69
|
91.78
|
* As per data uploaded by the PROs themselves in ECINET. Data from 6,345 PS in WB yet to be updated
+Data is provisional and it does not include Service Voters & Postal Ballots. Final figures will be shared in Index Cards through ECINET
(Release ID: 2255010)
Visitor Counter : 111020