|
Ministry of Statistics & Programme Implementation
FIRST PRESS RELEASE OF ALL INDIA INDEX OF INDUSTRIAL PRODUCTION OF NEW SERIES WITH BASE YEAR 2022-23
Driven by strong growth of 6.2% in Manufacturing Sector, Index of Industrial Production (IIP) records 4.9% Growth in April 2026
Posted On:
01 JUN 2026 4:35PM by PIB Delhi
The Ministry of Statistics and Programme Implementation (MoSPI) has revised the base year of the All India Index of Industrial Production (IIP) from 2011–12 to 2022–23 with the objective of making the index more representative of the current structure and dynamics of the industrial sector. The revised series incorporates an updated item basket, a revised weighting structure, and enhanced sectoral coverage to better capture recent developments in industrial activity across the economy.
The base year revision exercise was undertaken under the aegis of the Technical Advisory Committee for Base Year Revision of the All India Index of Industrial Production (TAC-IIP). The Committee's report was released on 25 May 2026, laying the foundation for a more robust, relevant, and comprehensive measure of industrial production in India.
For the new All India Index of Industrial Production (IIP) series, this press release is structured into two parts:
|
Part A
|
Quick Estimates of Index of Industrial Production and Use- Based Index for the Month of April 2026 (Base 2022-23=100)
|
|
Part B
|
Major Changes in New Series of IIP
|
Part A: Quick Estimates of Index of Industrial Production and Use- Based Index for the Month of April 2026 (Base 2022-23=100)
Key Highlights:
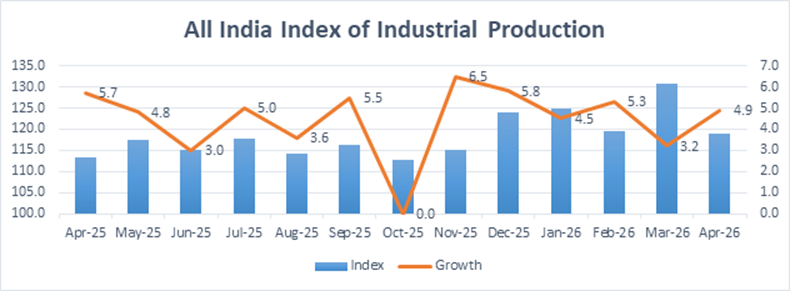
- i. The IIP growth rate for the month of April 2026 is 4.9 percent as compared to April 2025.
- The growth rates of the Four sectors, Mining & Quarrying, Manufacturing, Electricity & Gas Supply and Water Supply, Sewerage & Waste Management for the month of April 2026 are (-)5.1 percent, 6.2 percent, 4.9 percent and 6.6 percent respectively.
- The Quick Estimate of IIP stands at 118.9 against 113.4 in April 2025. The indices of Industrial Production for Mining & Quarrying, Manufacturing, Electricity & Gas Supply and Water Supply, Sewerage & Waste Management for the month of April 2026 stand at 104.6, 119.3, 125.5 and 146.1 respectively.
- Within the Manufacturing sector, 17 out of 23 industry groups at NIC 2 digit-level have recorded a positive growth in April 2026 over April 2025. The top three positive contributors for the month of April 2026 are – “Manufacture of motor vehicles, trailers and semi-trailers” (12.7%), “Manufacture of electrical equipment” (19.2%) and “Manufacture of machinery and equipment n.e.c.” (12.9%).
- In the industry group “Manufacture of motor vehicles, trailers and semi-trailers”, item groups “Auto Components, Spares and Accessories”, “Passenger Cars”, and “Rim (Wheel)” have shown significant contribution in growth.
- In the industry group “Manufacture of electrical equipment” item groups “Electrical Apparatus for Switching or Protecting Electrical Circuits (e.g., Switchgear, Circuit Breakers/Switches, Control/Meter Panels) and Parts Thereof”, “Articles of Graphite or Carbon Used for Electrical Purposes Including Carbon Electrodes and Carbon Brushes” and “Transformers (Small)” have shown significant contribution in growth.
- In the industry group “Manufacture of machinery and equipment n.e.c.”, item groups “Fire-Fighting Equipment”, “Cranes – All Types and Parts Thereof”, and “Stationary and Internal Combustion Piston Engines Not for Motor Vehicles” have shown significant contribution in growth.
- As per the Use-Based Classification, the indices stand at 114.3 for Primary Goods, 132.1 for Capital Goods, 119.7 for Intermediate Goods and 129.7 for Infrastructure/ Construction Goods for the month of April 2026. Further, the indices for Consumer durables and Consumer non-durables stand at 119.1 and 112.4 respectively.
- The corresponding growth rates of IIP as per Use-Based Classification in April 2026 over April 2025 are 0.4 percent in Primary Goods, 16.0 percent in Capital Goods, 7.7 percent in Intermediate Goods, 7.1 percent in Infrastructure/ Construction Goods, 4.3 percent in Consumer durables and 2.8 percent in Consumer non-durables (Statement III). Based on Use-Based Classification, top three positive contributors to the growth of IIP for the month of April 2026 are Intermediate Goods, Capital Goods and Infrastructure/ Construction Goods.
- Monthly Indices and Growth Rate (in %) of IIP for the last 13 months are given below:
2. Details of Quick Estimates of the Index of Industrial Production for the month of April 2026 at Sector, Sub-Sector, 2-digit level of National Industrial Classification (NIC-2025) and by Use-Based Classification are given at Statements I, II (A, B, C, D) and III respectively.
3. Release of the IIP for May 2026 will be on Monday, 29th June 2026.
 Note: - Note: -
- This Press Release (English and Hindi Version) is also available at the Ministry’s Website -http://www.mospi.gov.in.
- Detailed data pertaining to IIP is available at https://esankhyiki.mospi.gov.in/macroindicators?product=iip
|
STATEMENT I: INDEX OF INDUSTRIAL PRODUCTION – SECTORAL
|
|
(Base: 2022-23=100)
|
|
Months
|
Mining & Quarrying
|
Manufacturing
|
Electricity & Gas Supply
|
Water Supply, Sewerage & Waste Management
|
General
|
|
11.053
|
76.062
|
10.865
|
2.020
|
100.000
|
|
2023-24
|
2024-25
|
2025-26
|
2026-27
|
2023-24
|
2024-25
|
2025-26
|
2026-27
|
2023-24
|
2024-25
|
2025-26
|
2026-27
|
2023-24
|
2024-25
|
2025-26
|
2026-27
|
2023-24
|
2024-25
|
2025-26
|
2026-27
|
|
Apr*
|
97.3
|
109.6
|
110.2
|
104.6
|
100.2
|
105.6
|
112.3
|
119.3
|
98.8
|
112.7
|
119.6
|
125.5
|
109.6
|
126.7
|
137.1
|
146.1
|
99.9
|
107.2
|
113.4
|
118.9
|
|
May
|
100.7
|
108.4
|
114.8
|
|
105.6
|
111.4
|
116.6
|
|
102.6
|
119.5
|
123.6
|
|
111.0
|
126.8
|
137.6
|
|
104.8
|
112.3
|
117.6
|
|
|
Jun
|
99.9
|
104.5
|
108.8
|
|
104.4
|
111.8
|
114.8
|
|
100.6
|
115.6
|
119.4
|
|
113.2
|
127.3
|
137.3
|
|
103.7
|
111.7
|
115.1
|
|
|
Jul
|
82.8
|
86.0
|
95.3
|
|
104.8
|
113.9
|
119.1
|
|
107.2
|
122.1
|
126.1
|
|
113.7
|
128.6
|
138.2
|
|
102.8
|
112.0
|
117.6
|
|
|
Aug
|
82.5
|
78.3
|
90.7
|
|
108.3
|
112.3
|
116.7
|
|
116.1
|
123.7
|
115.2
|
|
115.7
|
129.8
|
138.7
|
|
106.4
|
110.1
|
114.1
|
|
|
Sep
|
83.0
|
83.3
|
96.4
|
|
106.7
|
112.9
|
119.4
|
|
111.4
|
116.0
|
111.6
|
|
117.0
|
130.3
|
138.4
|
|
104.8
|
110.3
|
116.4
|
|
|
Oct
|
101.6
|
102.9
|
106.0
|
|
106.3
|
113.5
|
113.2
|
|
108.4
|
113.8
|
111.6
|
|
118.6
|
133.1
|
141.2
|
|
106.2
|
112.8
|
112.8
|
|
|
Nov
|
99.6
|
103.5
|
106.8
|
|
101.1
|
108.1
|
117.7
|
|
103.4
|
108.7
|
101.9
|
|
120.5
|
134.7
|
140.5
|
|
101.6
|
108.2
|
115.2
|
|
|
Dec
|
112.4
|
117.0
|
117.7
|
|
110.8
|
116.7
|
125.9
|
|
106.4
|
118.4
|
114.7
|
|
121.3
|
135.4
|
141.3
|
|
110.7
|
117.3
|
124.1
|
|
|
Jan
|
117.3
|
121.2
|
120.6
|
|
110.0
|
119.1
|
125.0
|
|
109.4
|
117.9
|
125.3
|
|
122.7
|
135.8
|
142.7
|
|
111.0
|
119.6
|
124.9
|
|
|
Feb
|
116.9
|
117.5
|
114.7
|
|
109.1
|
113.0
|
119.7
|
|
100.6
|
108.1
|
117.4
|
|
123.7
|
135.8
|
143.4
|
|
109.3
|
113.5
|
119.4
|
|
|
Mar
|
132.0
|
128.7
|
125.4
|
|
117.8
|
127.0
|
131.9
|
|
109.9
|
119.5
|
124.7
|
|
126.2
|
137.5
|
146.3
|
|
118.7
|
126.6
|
130.7
|
|
|
|
|
|
|
|
|
|
|
|
|
|
|
|
|
|
|
|
|
|
|
|
|
Annual Index
|
102.2
|
105.1
|
109.0
|
|
107.1
|
113.8
|
119.4
|
|
106.2
|
116.3
|
117.6
|
|
117.8
|
131.8
|
140.2
|
|
106.7
|
113.5
|
118.4
|
|
|
|
|
|
|
|
|
|
|
|
|
|
|
|
|
|
|
|
|
|
|
|
|
Growth in Apr
|
-2.7
|
12.6
|
0.6
|
-5.1
|
0.2
|
5.4
|
6.4
|
6.2
|
-1.2
|
14.1
|
6.1
|
4.9
|
9.6
|
15.7
|
8.2
|
6.6
|
-0.1
|
7.3
|
5.7
|
4.9
|
|
Annual Growth
|
2.2
|
2.8
|
3.7
|
--
|
7.1
|
6.3
|
4.9
|
--
|
6.2
|
9.5
|
1.1
|
--
|
17.8
|
11.9
|
6.4
|
--
|
6.7
|
6.4
|
4.3
|
--
|
|
*Figures for April 2026 are Quick Estimates.
|
|
|
|
|
|
|
|
|
|
|
|
|
|
STATEMENT II A: INDEX OF INDUSTRIAL PRODUCTION - (Manufacturing at NIC 2 digit)
|
|
(Base: 2022-23=100)
|
|
NIC 2025
|
Description
|
Weights
|
Index
|
Cumulative Index
|
Percentage Growth
|
|
Apr'25
|
Apr'26*
|
Apr-Mar
|
Apr'26*
|
Apr-Mar
|
|
|
|
2024-25
|
2025-26
|
|
2025-26
|
|
10
|
Manufacture of food products
|
5.679
|
95.9
|
101.0
|
101.4
|
104.0
|
5.3
|
2.6
|
|
11
|
Manufacture of beverages
|
1.113
|
164.4
|
152.8
|
125.7
|
116.3
|
-7.1
|
-7.5
|
|
12
|
Manufacture of tobacco products
|
0.774
|
111.5
|
116.6
|
111.3
|
117.6
|
4.6
|
5.7
|
|
13
|
Manufacture of textiles
|
3.275
|
114.7
|
132.6
|
116.7
|
119.4
|
15.6
|
2.3
|
|
14
|
Manufacture of wearing apparel
|
1.970
|
98.5
|
91.6
|
101.6
|
98.5
|
-7.0
|
-3.1
|
|
15
|
Manufacture of leather and related products
|
0.607
|
96.8
|
98.3
|
100.2
|
100.0
|
1.5
|
-0.2
|
|
16
|
Manufacture of wood and products of wood and cork, except furniture; manufacture of articles of straw and plaiting materials
|
0.239
|
95.5
|
83.6
|
104.1
|
107.8
|
-12.5
|
3.6
|
|
17
|
Manufacture of paper and paper products
|
1.375
|
102.0
|
116.0
|
104.6
|
110.3
|
13.8
|
5.4
|
|
18
|
Printing and reproduction of recorded media
|
0.506
|
110.6
|
106.8
|
102.7
|
105.0
|
-3.4
|
2.2
|
|
19
|
Manufacture of coke and refined petroleum products
|
7.721
|
104.6
|
104.1
|
108.4
|
109.6
|
-0.4
|
1.1
|
|
20
|
Manufacture of chemicals and chemical products
|
7.813
|
104.0
|
104.4
|
109.6
|
108.7
|
0.4
|
-0.8
|
|
21
|
Manufacture of basic pharmaceuticals products and pharmaceutical preparations
|
5.833
|
113.7
|
117.5
|
119.3
|
119.6
|
3.4
|
0.3
|
|
22
|
Manufacture of rubber and plastics products
|
3.384
|
101.1
|
107.6
|
104.2
|
106.0
|
6.5
|
1.7
|
|
23
|
Manufacture of other non-metallic mineral products
|
3.519
|
111.3
|
116.0
|
109.4
|
115.6
|
4.3
|
5.7
|
|
24
|
Manufacture of basic metals
|
9.198
|
122.9
|
130.0
|
119.7
|
131.7
|
5.8
|
10.0
|
|
25
|
Manufacture of fabricated metal products, except machinery and equipment
|
2.481
|
111.4
|
124.3
|
115.5
|
125.6
|
11.7
|
8.7
|
|
26
|
Manufacture of computer, electronic and optical products
|
2.085
|
137.2
|
138.7
|
134.2
|
144.4
|
1.1
|
7.6
|
|
27
|
Manufacture of electrical equipment
|
3.175
|
126.3
|
150.6
|
123.5
|
139.5
|
19.2
|
13.0
|
|
28
|
Manufacture of machinery and equipment n.e.c.
|
5.020
|
108.5
|
122.5
|
119.9
|
130.0
|
12.9
|
8.4
|
|
29
|
Manufacture of motor vehicles, trailers and semi-trailers
|
6.417
|
116.0
|
130.8
|
112.8
|
124.5
|
12.7
|
10.4
|
|
30
|
Manufacture of other transport equipment
|
2.089
|
124.9
|
148.4
|
130.4
|
145.1
|
18.9
|
11.3
|
|
31
|
Manufacture of furniture
|
0.283
|
113.6
|
111.1
|
107.3
|
118.9
|
-2.2
|
10.8
|
|
32
|
Other manufacturing
|
1.509
|
124.3
|
124.6
|
115.5
|
117.6
|
0.3
|
1.8
|
|
10-32
|
Manufacturing
|
76.062
|
112.3
|
119.3
|
113.8
|
119.4
|
6.2
|
4.9
|
| |
|
|
|
|
|
|
|
|
*Figures for April 2026 are Quick Estimates.
|
STATEMENT II-B: INDEX OF INDUSTRIAL PRODUCTION - (Mining & Quarrying)
|
|
(Base: 2022-23=100)
|
|
NIC 2025
|
Description
|
Weights
|
Index
|
Cumulative Index
|
Percentage growth
|
|
Apr'25
|
Apr'26*
|
Apr-Mar
|
Apr'26*
|
Apr-Mar
|
|
|
|
2024-25
|
2025-26
|
|
2025-26
|
|
|
|
|
|
|
|
|
|
|
|
05-06
|
Fuel Minerals
|
5.647
|
101.6
|
95.9
|
105.7
|
103.6
|
-5.7
|
-2.0
|
|
07
|
Metallic Minerals incl. Rare Earth Minerals
|
1.995
|
116.1
|
130.4
|
110.0
|
118.3
|
12.3
|
7.5
|
|
08
|
Non-Metallic Minerals incl. Minor Mineral
|
3.411
|
121.0
|
103.9
|
101.2
|
112.4
|
-14.2
|
11.1
|
|
05-08
|
Mining & Quarrying
|
11.053
|
110.2
|
104.6
|
105.1
|
109.0
|
-5.1
|
3.7
|
|
|
|
STATEMENT II-C: INDEX OF INDUSTRIAL PRODUCTION - (Electricity & Gas Supply)
|
|
(Base: 2022-23=100)
|
|
NIC 2025
|
Description
|
Weights
|
Index
|
Cumulative Index
|
Percentage Growth
|
|
Apr'25
|
Apr'26*
|
Apr-Mar
|
Apr'26*
|
Apr-Mar
|
|
|
|
2024-25
|
2025-26
|
|
2025-26
|
|
3512
|
Electricity Generation from Renewable Sources
|
2.332
|
106.8
|
126.0
|
108.8
|
129.0
|
18.0
|
18.6
|
|
3511
|
Electricity Generation from Non-Renewable Sources
|
7.839
|
124.0
|
127.5
|
118.3
|
114.4
|
2.8
|
-3.3
|
|
351
|
Electricity
|
10.171
|
120.1
|
127.2
|
116.2
|
117.7
|
5.9
|
1.3
|
|
352
|
Gas Supply
|
0.694
|
113.0
|
100.3
|
118.9
|
115.9
|
-11.2
|
-2.5
|
|
35
|
Electricity & Gas Supply
|
10.865
|
119.6
|
125.5
|
116.3
|
117.6
|
4.9
|
1.1
|
|
|
|
STATEMENT II-D: INDEX OF INDUSTRIAL PRODUCTION - Water Supply, Sewerage & Waste Management
|
|
(Base: 2022-23=100)
|
|
NIC 2025
|
Description
|
Weights
|
Index
|
Cumulative Index
|
Percentage Growth
|
|
Apr'25
|
Apr'26*
|
Apr-Mar
|
Apr'26*
|
Apr-Mar
|
|
|
|
2024-25
|
2025-26
|
|
2025-26
|
|
36
|
Water Supply
|
1.059
|
149.7
|
156.2
|
143.6
|
152.4
|
4.4
|
6.1
|
|
37-38
|
Sewerage & Waste Management
|
0.961
|
123.2
|
134.9
|
118.9
|
126.8
|
9.5
|
6.6
|
|
36-38
|
Water Supply, Sewerage & Waste Management
|
2.020
|
137.1
|
146.1
|
131.8
|
140.2
|
6.6
|
6.4
|
| |
|
|
|
|
|
|
|
|
|
*Figures for April 2026 are Quick Estimates.
|
|
STATEMENT III: INDEX OF INDUSTRIAL PRODUCTION – USE-BASED
|
|
(Base :2022-23=100)
|
|
Month
|
Primary Goods
|
Capital Goods
|
Intermediate Goods
|
Infrastructure/
Construction Goods
|
Consumer durables
|
Consumer
non-durables
|
|
31.136
|
8.082
|
22.416
|
10.908
|
11.311
|
16.147
|
|
2023-24
|
2024-25
|
2025-26
|
2026-27
|
2023-24
|
2024-25
|
2025-26
|
2026-27
|
2023-24
|
2024-25
|
2025-26
|
2026-27
|
2023-24
|
2024-25
|
2025-26
|
2026-27
|
2023-24
|
2024-25
|
2025-26
|
2026-27
|
2023-24
|
2024-25
|
2025-26
|
2026-27
|
|
Apr*
|
99.5
|
111
|
113.9
|
114.3
|
96.5
|
100.1
|
113.9
|
132.1
|
100.4
|
103.3
|
111.1
|
119.7
|
105.5
|
113.8
|
121.1
|
129.7
|
95.5
|
106.5
|
114.2
|
119.1
|
100.9
|
105.0
|
109.3
|
112.4
|
|
May
|
103.5
|
114.1
|
118.7
|
|
102.8
|
112.1
|
123.1
|
|
106.4
|
110.3
|
115.3
|
|
107.6
|
117.0
|
123.9
|
|
99.0
|
109.8
|
114.2
|
|
108.3
|
110.1
|
114.2
|
|
|
Jun
|
102
|
109.8
|
114.2
|
|
109.6
|
121.3
|
126.2
|
|
102.4
|
109.9
|
112.5
|
|
106.9
|
116.1
|
124.0
|
|
98.9
|
109.1
|
113.5
|
|
106.7
|
112.1
|
109.9
|
|
|
Jul
|
98.2
|
107
|
112.5
|
|
105.1
|
117.8
|
125.3
|
|
104.9
|
117.5
|
118.2
|
|
106.9
|
114.9
|
127.8
|
|
102.9
|
113.3
|
120.4
|
|
104.9
|
108.3
|
114.0
|
|
|
Aug
|
100.3
|
103.4
|
106.6
|
|
114.0
|
116.0
|
124.1
|
|
107.5
|
111.4
|
115.1
|
|
111.3
|
114.2
|
125.0
|
|
107.9
|
116.0
|
119.2
|
|
108.6
|
111.5
|
111.1
|
|
|
Sep
|
98.2
|
102.1
|
105.9
|
|
117.3
|
125.3
|
142.9
|
|
104.8
|
109.5
|
116.4
|
|
108.5
|
113.2
|
124.7
|
|
108.4
|
120.7
|
127.7
|
|
106.3
|
110.6
|
109.9
|
|
|
Oct
|
104.3
|
109.1
|
111.5
|
|
108.0
|
112.9
|
122.0
|
|
105.4
|
111.3
|
112.4
|
|
109.9
|
116.8
|
122.9
|
|
112.1
|
122.3
|
116.7
|
|
103.6
|
112.5
|
101.5
|
|
|
Nov
|
103.4
|
108.2
|
107.5
|
|
101.6
|
111.1
|
132.0
|
|
100.8
|
107.8
|
115.4
|
|
102.7
|
111.8
|
125.6
|
|
95.3
|
105.2
|
120.6
|
|
102.8
|
106.9
|
110.7
|
|
|
Dec
|
110.9
|
118.6
|
117.7
|
|
108.7
|
126.3
|
144.5
|
|
112.6
|
115.7
|
123.5
|
|
112.4
|
121.8
|
137.1
|
|
100.4
|
109.8
|
119.5
|
|
115.0
|
114.6
|
121.5
|
|
|
Jan
|
112
|
119.6
|
122.3
|
|
109.2
|
121.0
|
138.3
|
|
108.5
|
118.0
|
125.1
|
|
114.5
|
124.7
|
141.2
|
|
111.8
|
122.6
|
122.6
|
|
110.5
|
115.5
|
113.7
|
|
|
Feb
|
108.3
|
112.4
|
114.9
|
|
113.9
|
125.1
|
149.0
|
|
106.0
|
110.0
|
114.6
|
|
112.5
|
120.0
|
133.1
|
|
112.5
|
114.9
|
120.3
|
|
109.3
|
109.0
|
110.1
|
|
|
Mar
|
119.2
|
122.9
|
124.5
|
|
142.6
|
164.3
|
182.7
|
|
113.7
|
121.4
|
126.4
|
|
121.5
|
134.0
|
141.8
|
|
114.1
|
122.4
|
125.3
|
|
114.1
|
119.8
|
118.7
|
|
|
|
|
|
|
|
|
|
|
|
|
|
|
|
|
|
|
|
|
|
|
|
|
|
|
|
|
Annual Index
|
105.0
|
111.5
|
114.2
|
--
|
110.8
|
121.1
|
135.3
|
--
|
106.1
|
112.2
|
117.2
|
--
|
110
|
118.2
|
129.0
|
--
|
104.9
|
114.4
|
119.5
|
--
|
107.6
|
111.3
|
112.1
|
--
|
|
|
|
|
|
|
|
|
|
|
|
|
|
|
|
|
|
|
|
|
|
|
|
|
|
|
|
Growth in Apr
|
-0.5
|
11.6
|
2.6
|
0.4
|
-3.5
|
3.7
|
13.8
|
16.0
|
0.4
|
2.9
|
7.6
|
7.7
|
5.5
|
7.9
|
6.4
|
7.1
|
-4.5
|
11.5
|
7.2
|
4.3
|
0.9
|
4.1
|
4.1
|
2.8
|
|
Annual Growth
|
5.0
|
6.2
|
2.4
|
--
|
10.8
|
9.3
|
11.7
|
--
|
6.1
|
5.7
|
4.5
|
--
|
10.0
|
7.5
|
9.1
|
--
|
4.9
|
9.1
|
4.5
|
--
|
7.6
|
3.4
|
0.7
|
--
|
|
*Figures for April 2026 are Quick Estimates.
|
|
|
|
|
|
|
|
|
|
|
|
|
|
|
|
|
|
|
PART B: Major Changes in New Series of IIP
What’s New
· Base year revised from 2011-12 to 2022-23.
- Expanded scope & coverage by including Gas Supply, Water Supply, Sewerage, and Waste Management activities while retaining the existing sectors.
- Greater granularity by providing separate indices for
- Electricity generation from Renewable and Non-renewable sources
- Fuel Minerals, Metallic Minerals and Non-Metallic Minerals
· Item basket revamped to cover 463 item groups:
-
- Additions: Cards with a magnetic stripe, CCTV camera, Articles of non-woven textiles, Parts of aircraft and spacecraft, Stents, Vaccine (other than veterinary).
- Deletions: Kerosene, Fluorescent tubes and CFLs, Tubes for bicycle/ tricycle/ rickshaw tyres. Tubes for LMV tyres, Printing machinery, Sewing machines.
|
- Expanded Scope & Coverage - In the new IIP series (2022–23), the coverage has been broadened by incorporating Gas Supply and Water Supply, Sewerage & Waste Management activities, while retaining the existing three core sectors—Mining, Manufacturing, and Electricity. In the Mining sector, the new series includes minor minerals and rare earth minerals in addition to major minerals, making the index more inclusive and representative of the sector. This expansion ensures that the IIP captures more comprehensive and accurate reflection of industrial production in the economy and aligns it better with global standards.
- Enhanced Granularity –The new IIP series provides a more detailed disaggregation of industrial activities, enabling better analysis of sectoral performance. In the Mining & Quarrying sector, the index is now available at a more granular level, covering: (i) Fuel Minerals, (ii) Metallic Minerals, including Rare Earth Minerals, and (iii) Non-Metallic Minerals, including Minor Minerals. This enhanced classification offers deeper insights into the contribution and performance of different mineral categories.
Similarly, the Electricity Index is now compiled at a more disaggregated level based on the source of electricity generation: (i) Non-Renewable Sources and (ii) Renewable Sources. This improvement allows the index to better capture the ongoing transition towards cleaner and more sustainable energy sources, while providing a clearer picture of changes in the energy mix over time.
- Revamped Item Basket - The item basket and weights have been revised to add relevant commodities and remove outdated ones, ensuring that each item or sector is assigned appropriate significance. The revised basket consists of 1,042 products mapped to 463 item groups as compare to 839 items mapped to 407 item groups in 2011-12 series. This revision better captures changes in the industrial landscape, including the emergence of new products and shifts in production patterns over time.
- The number of item groups for which production data is collected in value terms have been significantly enhanced in the new IIP series, increasing to 234 item groups as compared to 109 item groups in the old series.
- Updated Weights – The weights are updated using latest data on Gross Value Added from National Accounts Statistics (base 2022-23) at sectoral level and Annual Survey of Industries at NIC-2/3/4 digit for the financial year 2022-23. In Electricity sector, the weights are based on the share of each source in total revenue generated during FY 2022–23. Whereas, in Mining & Quarrying sector, weights are updated according to share in GVA of each mineral received from IBM and NAS for FY 2022-23.
- The comparison of item basket and weights of new IIP series with the old series at sectoral level is given in table below:
Table B.1: Comparison of item basket and weights of new IIP series with the old series
|
Sector
|
Base year 2011-12
|
Base year 2022-23
|
|
Weights (in %)
|
Item groups
|
Weights (in %)
|
Item groups
|
|
Mining & Quarrying
|
14.372
|
1
|
11.053
|
3
|
|
Manufacturing
|
77.633
|
405
|
76.062
|
455
|
|
Electricity & Gas Supply
|
7.995
|
1
|
10.865
|
3
|
|
Water Supply; Sewerage and Waste Management*
|
--
|
--
|
2.020
|
2
|
|
Total
|
100
|
407
|
100
|
463
|
*entire new sector has been added in the new IIP series with base 2022-23
- The comparison of item basket and weights of new IIP series with the old series at Sub-sectoral and NIC-2 Digit level is given in table Table B.2.
Table B.2: Comparison of item basket and weights at Sub-sectoral and NIC 2-Digit level
|
NIC 2025
|
Sectoral and NIC Wise
|
2011-12 Series
|
2022-23 series
|
|
Weights
|
No. of Item Groups
|
Weights
|
No. of Item Groups
|
|
05-06
|
Fuel Minerals
|
--
|
--
|
5.647
|
1
|
|
07
|
Metallic Minerals incl. Rare earth Minerals
|
--
|
--
|
1.995
|
1
|
|
08
|
Non-Metallic Minerals incl. Minor Minerals
|
--
|
--
|
3.411
|
1
|
|
05-08
|
Mining & Quarrying
|
14.372
|
1
|
11.053
|
3
|
|
10
|
Manufacture of food products
|
5.302
|
53
|
5.679
|
56
|
|
11
|
Manufacture of beverages
|
1.035
|
7
|
1.113
|
6
|
|
12
|
Manufacture of tobacco products
|
0.798
|
3
|
0.774
|
3
|
|
13
|
Manufacture of textiles
|
3.291
|
18
|
3.275
|
25
|
|
14
|
Manufacture of wearing apparel
|
1.322
|
4
|
1.970
|
5
|
|
15
|
Manufacture of leather and related products
|
0.502
|
3
|
0.607
|
9
|
|
16
|
Manufacture of wood and products of wood and cork, except furniture; manufacture of articles of straw and plaiting materials
|
0.193
|
6
|
0.239
|
6
|
|
17
|
Manufacture of paper and paper products
|
0.872
|
3
|
1.375
|
3
|
|
18
|
Printing and reproduction of recorded media
|
0.680
|
6
|
0.506
|
3
|
|
19
|
Manufacture of coke and refined petroleum products
|
11.775
|
10
|
7.721
|
8
|
|
20
|
Manufacture of chemicals and chemical products
|
7.873
|
65
|
7.813
|
68
|
|
21
|
Manufacture of basic pharmaceuticals products and pharmaceutical preparations
|
4.981
|
20
|
5.833
|
22
|
|
22
|
Manufacture of rubber and plastics products
|
2.422
|
25
|
3.384
|
27
|
|
23
|
Manufacture of other non-metallic mineral products
|
4.085
|
15
|
3.519
|
20
|
|
24
|
Manufacture of basic metals
|
12.804
|
28
|
9.198
|
33
|
|
25
|
Manufacture of fabricated metal products, except machinery and equipment
|
2.655
|
19
|
2.481
|
28
|
|
26
|
Manufacture of computer, electronic and optical products
|
1.570
|
18
|
2.085
|
17
|
|
27
|
Manufacture of electrical equipment
|
2.998
|
33
|
3.175
|
29
|
|
28
|
Manufacture of machinery and equipment n.e.c.
|
4.765
|
37
|
5.020
|
36
|
|
29
|
Manufacture of motor vehicles, trailers and semi-trailers
|
4.857
|
7
|
6.417
|
11
|
|
30
|
Manufacture of other transport equipment
|
1.776
|
6
|
2.089
|
11
|
|
31
|
Manufacture of furniture
|
0.131
|
3
|
0.283
|
5
|
|
32
|
Other manufacturing
|
0.941
|
16
|
1.509
|
24
|
|
10—32
|
Manufacturing
|
77.633
|
405
|
76.062
|
455
|
|
3512
|
Electricity Generation from Renewable Sources
|
--
|
--
|
2.332
|
1
|
|
3511
|
Electricity Generation from Non-Renewable Sources
|
--
|
--
|
7.839
|
1
|
|
351
|
Electricity
|
7.995
|
1
|
10.171
|
2
|
|
3512
|
Gas Supply
|
--
|
--
|
0.694
|
1
|
|
352
|
Electricity & Gas Supply
|
--
|
--
|
10.865
|
3
|
|
36
|
Water Supply
|
--
|
--
|
1.059
|
1
|
|
37-38
|
Sewerage & Waste Management
|
--
|
--
|
0.961
|
1
|
|
36-38
|
Water Supply, Sewerage & Waste Management
|
--
|
--
|
2.020
|
2
|
|
|
General Index
|
100
|
407
|
100
|
463
|
- The six Use-Based Categories of the 2011-12 series will continue in the new series of IIP. Though, the categories themselves were not changed; individual item groups classifications were reviewed in detail and updated under the Use-Based Category.
- In the new IIP series with base year 2022-23, the practice of using the Wholesale Price Index (WPI) to deflate item groups for which production data is reported in value terms will continue. The Output PPI will be used once it is released, after examining its stability.
- The National Industrial Classification 2025 will be used in the compilation and dissemination of the new series.
- Provision for Substitution of Factories that have closed down or become non-operational during the currency of the series has been incorporated in the new IIP series, which will maintain representativeness and reliability of the index.
- In the new series of IIP with base year 2022-23, there are total 16 data Source Agencies. The existing source agencies for compilation of IIP include the i) Indian Bureau of Mines, ii) Directorate of Sugar and Vegetable Oils, iii)Tea Board India, iv) Office of the Textile Commissioner, v) Office of the Jute Commissioner, vi) Ministry of Petroleum and Natural Gas, vii) Ministry of Steel, viii) Railway Board, ix) Department for Promotion of Industry and Internal Trade, x) Department of Chemicals and Petrochemicals, xi) Department of Fertilisers and xii) Central Electricity Authority. The new source agencies introduced in the new series include xiii) IREL (India) Limited, Department of Atomic Energy for rare earth minerals xiv) Directorates of Economics and Statistics (DES) of States for minor minerals, and xv) Ministry of Housing and Urban Affairs (MoHUA) and xvi) Department of Drinking Water & Sanitation for the newly included activities relating to water supply, sewerage and waste management.
- Linking Factor:
It is provided at sectoral level to link the new series with previous IIP series. The linking factor is calculated using the Geometric Mean (GM) method as follows:

The linked series is obtained by dividing the indices of old series with the coefficient (linking factor) calculated above.
- At lower levels of disaggregation, the item basket changes significantly between base years due to the inclusion of new products and the dropping of obsolete ones. Therefore, deriving linking factors at lower level may not yield reliable results.
Linking Factor for linking 2011-12 series with 2022-23 series are given in the below table:
|
S. No.
|
Sector
|
Linking Factor
|
|
1
|
Mining & Quarrying
|
1.1890
|
|
2
|
Manufacturing
|
1.3700
|
|
3
|
Electricity
|
1.8495
|
|
4
|
General
|
1.3834
|
- Since there has been an expansion in the scope of IIP in the new series with base year 2022-23, there may not be a direct correspondence between the two series. The new sector, namely water supply, sewerage & waste management, in the all-India IIP with base year 2022-23, was not covered in the earlier series. Hence, linking factor for the same cannot be computed. Although, the linking factor for the general index is being provided, users may exercise caution while comparing the indices of the two series.
- It may be noted, as matter of policy, MoSPI does not prescribe any specific method for linking or converting indices from one series to another. The choice of methodology for linking the series is left to the users, depending on their analytical requirements.
- Comparative Annual Growth Rates in Overlapping Period of 2022-23 series and 2011-12 Series:
Based on monthly production figures provided by the source agencies from April 2022 till April 2026, the annual growth rates were compiled and presented in following statements:
- Statement IV: The Annual Growth Rates of Index of Industrial Production with base 2022-23 vis-à-vis 2011-12: Sectoral
- Statement V: The Annual Growth Rates of Index of Industrial Production with base 2022-23 vis-à-vis 2011-12: Use Based
While comparing the new IIP series with the old series, users may note that differences in coverage, methodology, item basket, sectoral composition and weighting structure have affected the comparability of growth rates across the two series. The growth rates of the two series are not strictly comparable due to following reasons:
- The indices for 2022-23 have been normalize to100 at a monthly level.
- There has been an increase in number of factories in panel for reporting data and closed ones have been removed.
- The item basket has been revised with inclusion of new items and exclusion of old ones.
- The electricity sector has undergone significant changes in the new series. Unlike the old series, which covered only electricity generation, the new series includes both Electricity & Gas Supply activities. Further, while the old series used total electricity generation from all sources as a single indicator, the new series compiles the electricity index as a weighted index of electricity generated from two different sources Renewable (hydro, wind and solar) and Non-Renewable (thermal, nuclear). The weights are based on the share of each source in total revenue generated during FY 2022–23.
- The coverage and composition of the Mining & Quarrying sector have undergone significant changes in the new series. The new series includes minor minerals and rare earth minerals, which were not covered in the old series. The inclusion of minor minerals has a substantial impact on the growth pattern of the sector, as these minerals account for a significant share in GVA of the total Mining & Quarrying sector as per National Accounts estimates for 2022–23. In addition, the weights of common minerals have also been revised in the new series. Therefore, growth rates of the Mining & Quarrying sector in the old and new series are also not strictly comparable.
- The detailed tables including indices at Sectoral level, Manufacturing NIC-2-digit level, Sub-sectoral level of Mining & Quarrying, Electricity & Gas Supply, Water Supply, Sewerage & Waste Management and as per Use-Based Classification for new series from April 2023 onwards are available at e-Sankhyiki Portal (MoSPI) through below link:
https://esankhyiki.mospi.gov.in/macroindicators?product=iip
The IIP 2022-23 series marks a significant strengthening of India’s industrial production measurement framework. With updated base year, revised item basket and weights, improved sectoral coverage, and enhanced use of data sources, the new series provides a more representative, reliable, and methodologically robust measure of industrial growth, aligned with evolving economic structures and international best practices.
For more details, Report of the Technical Advisory Committee New Series of All India Index of Industrial Production 2022-23 may be seen at this link.
Statement IV: The Annual Growth Rates of Index of Industrial Production with base 2022-23 vis-à-vis 2011-12: Sectoral
General
|
Series
|
Weights
|
2023-24
|
2024-25
|
2025-26
|
|
Growth Rates
|
|
2022-23
|
100.0000
|
6.7
|
6.4
|
4.3
|
|
2011-12
|
5.9
|
4.0
|
4.1
|
Mining & Quarrying
|
Series
|
Weights
|
2023-24
|
2024-25
|
2025-26
|
|
Growth Rates
|
|
2022-23
|
11.053
|
2.2
|
2.8
|
3.7
|
|
2011-12
|
14.373
|
7.5
|
3.0
|
1.4
|
Manufacturing
|
Series
|
Weights
|
2023-24
|
2024-25
|
2025-26
|
|
Growth Rates
|
|
2022-23
|
76.062
|
7.1
|
6.3
|
4.9
|
|
2011-12
|
77.633
|
5.5
|
4.1
|
5.0
|
Electricity & Gas Supply
|
Series
|
Weights
|
2023-24
|
2024-25
|
2025-26
|
|
Growth Rates
|
|
2022-23
|
10.865
|
6.2
|
9.5
|
1.1
|
|
2011-12
|
7.994
|
7.1
|
5.2
|
1.0
|
Water Supply, Sewerage & Waste Management
|
Series
|
Weights
|
2023-24
|
2024-25
|
2025-26
|
|
Growth Rates
|
|
2022-23
|
2.020
|
17.8
|
11.9
|
6.4
|
Statement V: The Annual Growth Rates of Index of Industrial Production with base 2022-23 vis-à-vis 2011-12: Use Based
|
|
Weights
|
Series
|
2023-24
|
2024-25
|
2025-26
|
|
Primary Goods
|
31.136
|
2022-23
|
5.0
|
6.2
|
2.4
|
|
34.049
|
2011-12
|
6.1
|
3.9
|
1.2
|
|
Capital Goods
|
8.082
|
2022-23
|
10.8
|
9.3
|
11.7
|
|
8.224
|
2011-12
|
6.3
|
5.6
|
8.3
|
|
Intermediate Goods
|
22.416
|
2022-23
|
6.1
|
5.7
|
4.5
|
|
17.221
|
2011-12
|
5.3
|
4.3
|
5.5
|
|
Infrastructure/ Construction Goods
|
10.908
|
2022-23
|
10.0
|
7.5
|
9.1
|
|
12.338
|
2011-12
|
9.7
|
6.7
|
9.8
|
|
Consumer durables
|
11.311
|
2022-23
|
4.9
|
9.1
|
4.5
|
|
12.839
|
2011-12
|
3.6
|
7.9
|
5.9
|
|
Consumer non-durables
|
16.147
|
2022-23
|
7.6
|
3.4
|
0.7
|
|
15.329
|
2011-12
|
4.1
|
-1.5
|
0.1
|
********
Samrat/Pranab
(Release ID: 2267531)
|