Ministry of Statistics & Programme Implementation
PROVISIONAL ESTIMATES OF ANNUAL GROSS DOMESTIC PRODUCT FOR 2025-26 AND QUARTERLY ESTIMATES OF GROSS DOMESTIC PRODUCT FOR THE FOURTH QUARTER (JANUARY-MARCH) OF 2025-26
Provisional Estimates for the Financial Year 2025-26 shows Real GDP Growth Rate of 7.7%
In Q4 (January-March) of FY 2025-26, Real GDP has been estimated to grow by 7.8%
प्रविष्टि तिथि:
05 JUN 2026 4:00PM by PIB Delhi
The Ministry of Statistics and Programme Implementation (MoSPI) is releasing in this Press Note, the Provisional Estimates (PE) of Annual Gross Domestic Product (GDP) for the Financial Year (2025-26) and Quarterly Estimates of GDP for the Fourth Quarter (Q4, January-March) of FY 2025-26 along with its Expenditure components both at Constant (2022-23) and Current prices. The Ministry has released the New Series of Annual and Quarterly GDP estimates with base year 2022-23 on 27th February, 2026. In that release, the Quarterly GDP estimates and other aggregates were published from Q1 (April-June) of 2022-23 to Q3 (October-December) of FY 2025-26. Consequently, the Second Advance Estimates released on February, 2026 was based on information available for the FY 2025-26 upto Q3. Now, on account of information received for the Q4 of FY 2025-26, the Annual Estimates for the FY 2025-26 have been revised and being released in this press note. The press release is structured as follows.
|
I
|
Annual GDP Estimates and Growth Rates
|
|
II
|
Quarterly GDP Estimates and Growth Rates
|
|
III
|
Methodology and Major Data Sources
|
|
IV
|
Statements:
- Provisional Estimates of GDP along with Expenditure Components and National Income at Constant and Current Prices (Table 1 and 2)
- Provisional Estimates of Gross Value Added (GVA) at Constant and Current Prices (Table 3 & 4)
- Quarterly GDP Estimates along with Expenditure Components at Constant and Current Prices (Table 5, 6, 7 & 8)
|
|
Annexure
|
- Year-on-Year (Y-o-Y) Growth Rates in Indicators
|
KEY HIGHLIGHTS
I. Annual GDP Estimates and Growth Rates
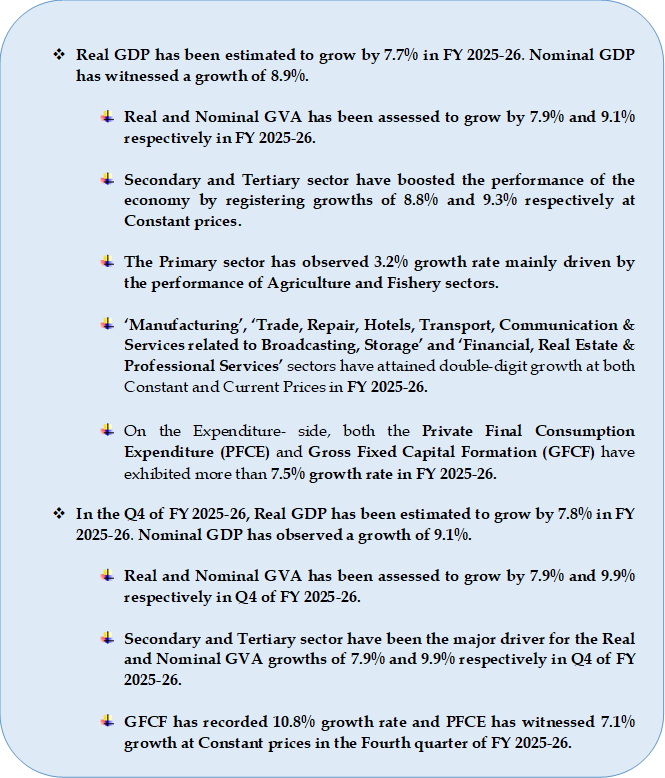
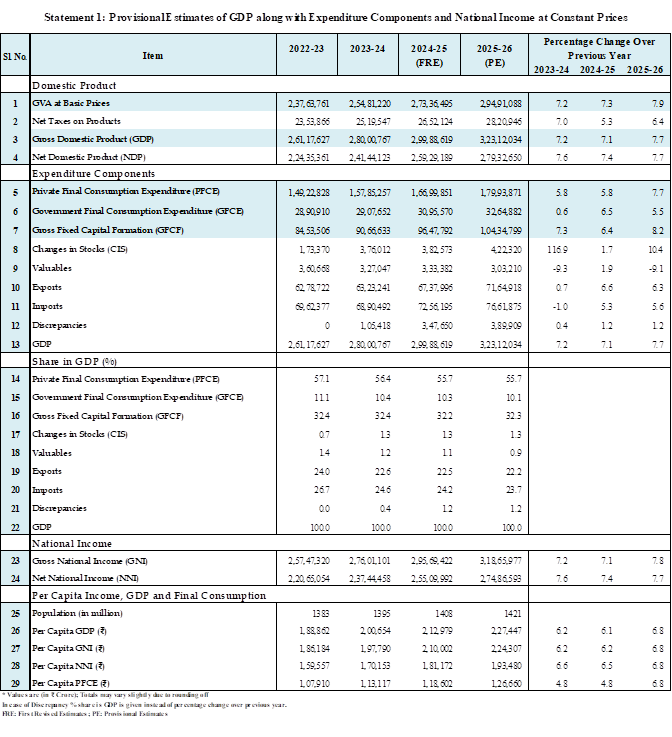
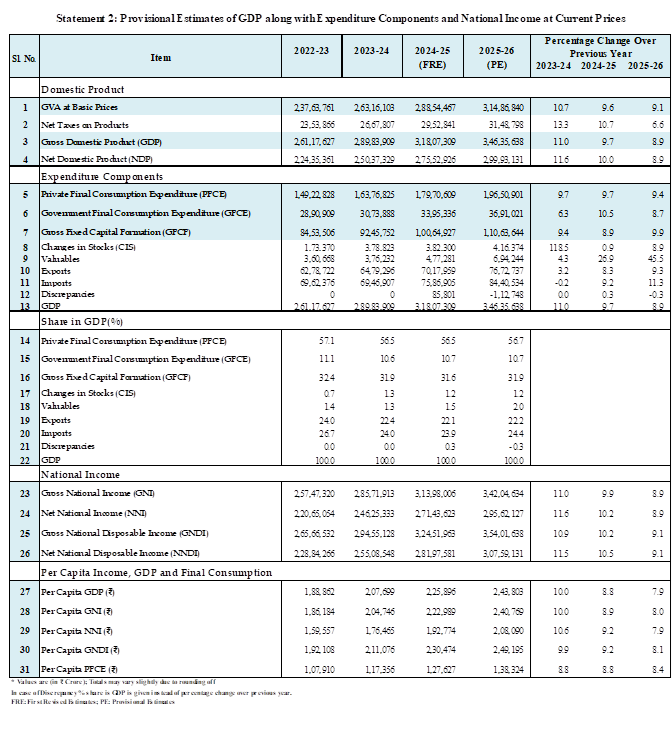
Real GDP or GDP at Constant Prices is estimated to attain a level of ₹323.12 lakh crore in the FY 2025-26, against the First Revised Estimate (FRE) of GDP for the year 2024-25 of ₹299.89 lakh crore. The growth rate in Real GDP during 2025-26 is estimated at 7.7% as compared to 7.1 % in 2024-25. Nominal GDP or GDP at Current Prices is estimated to attain a level of ₹346.36 lakh crore in the year 2025-26, against ₹318.07 lakh crore in 2024-25, showing a growth rate of 8.9%.
Real GVA is estimated at ₹294.91 lakh crore in the year 2025-26, against ₹273.36 lakh crore in FY 2024-25, registering a growth rate of 7.9% as compared to 7.3% growth rate in 2024-25. Nominal GVA is estimated to attain a level of ₹314.87 lakh crore during FY 2025-26, against ₹288.54 lakh crore in 2024-25, showing a growth rate of 9.1%.
Fig. 1: Annual GDP and GVA Estimates along with Y-o-Y Growth Rates at Constant Prices
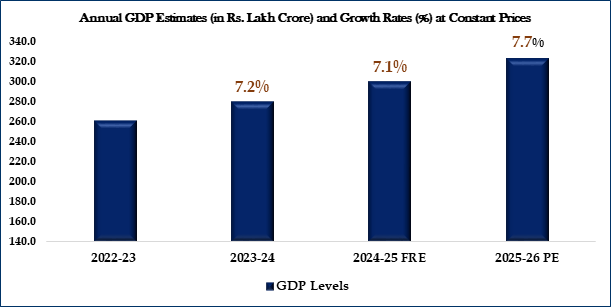
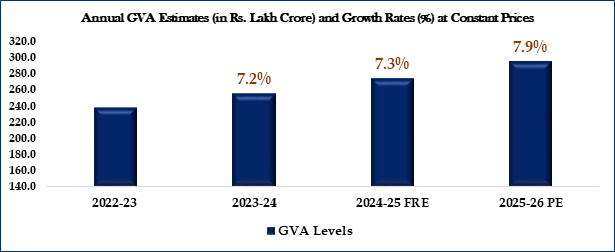
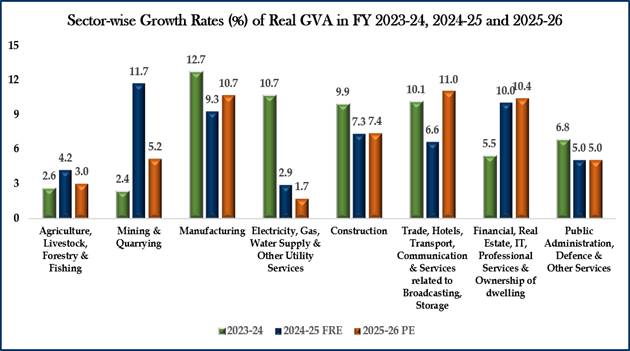
Fig. 2: Sectoral Composition and Growth Rates of Annual GVA
|
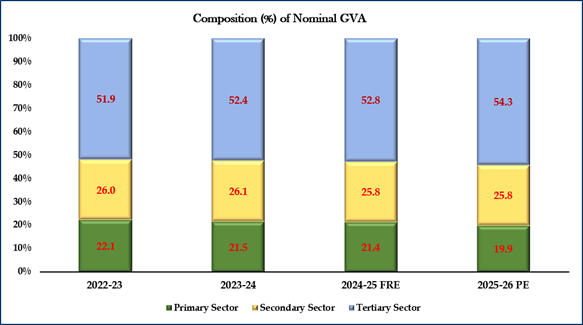
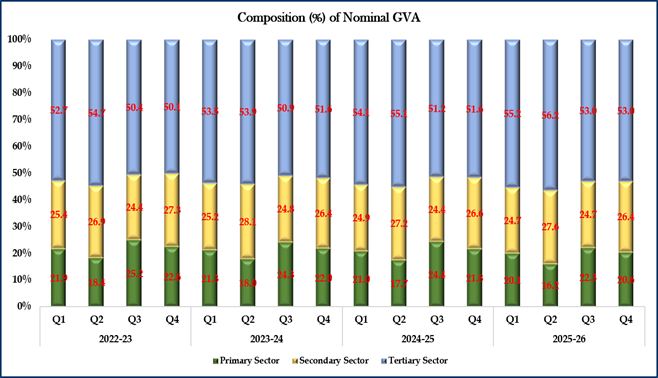
Sectoral Composition of Nominal GVA in FY 2025-26
|
|
|
|
|
*Public Administration, Defence & Other Services category includes the Other Services sector i.e. Education, Health, Recreation, and other personal services
Fig. 3: Composition and Growth Rates of Annual GVA in Broad Sectors
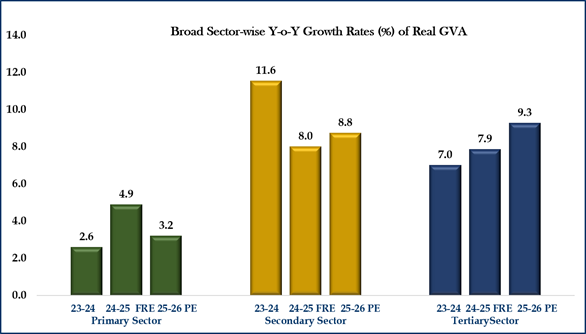
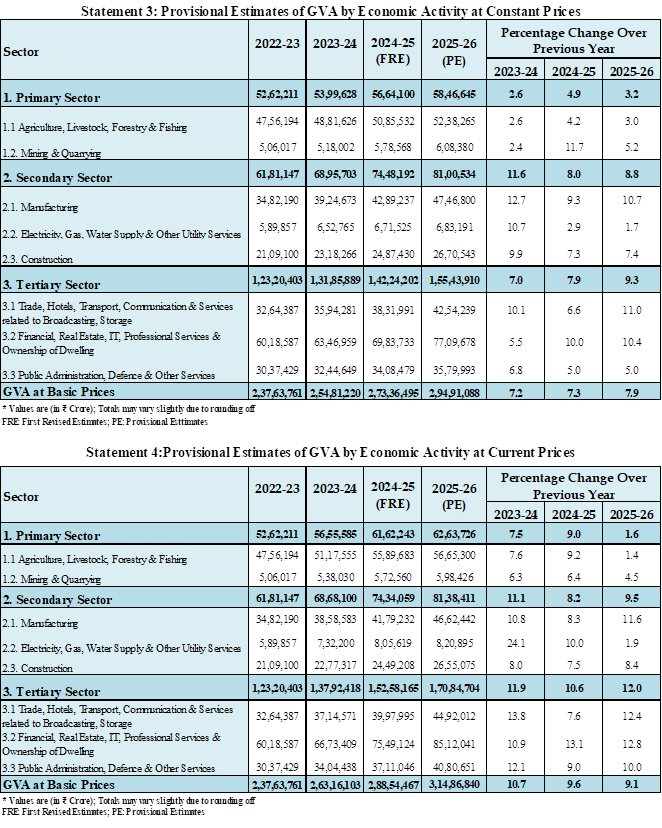
[Primary Sector: Agriculture, Livestock, Forestry & Fishing and Mining & Quarrying
Secondary Sector: Manufacturing; Electricity, Gas, Water supply & Other Utility Services and Construction
Tertiary Sector: Trade, Hotels, Transport, Communication and Services related to Broadcasting, Storage; Financial, Real Estate, IT, & Professional Services, Ownership of Dwelling and Public Administration, Defence & Other Services]
II. Quarterly Estimates and Growth Rates
Real GDP or GDP at Constant Prices in Q4 of FY 2025-26 is estimated at ₹87.77 lakh crore, against ₹81.40 lakh crore in Q4 of FY 2024-25, showing a growth rate of 7.8%. Nominal GDP or GDP at Current Prices in Q4 of FY 2025-26 is estimated at ₹94.65 lakh crore, against ₹86.75 lakh crore in Q4 of FY 2024-25, showing a growth rate of 9.1%.
Real GVA in Q4 of FY 2025-26 is estimated at ₹80.18 lakh crore, against ₹74.32 lakh crore in Q4 of FY 2024-25, showing a growth rate of 7.9%. Nominal GVA in Q4 of FY 2025-26 is estimated at ₹86.46 lakh crore, against ₹78.68 lakh crore in Q4 of FY 2024-25, showing a growth rate of 9.9%.
Fig. 4: Quarterly GDP and GVA Estimates along with Y-o-Y Growth Rates at Constant Prices

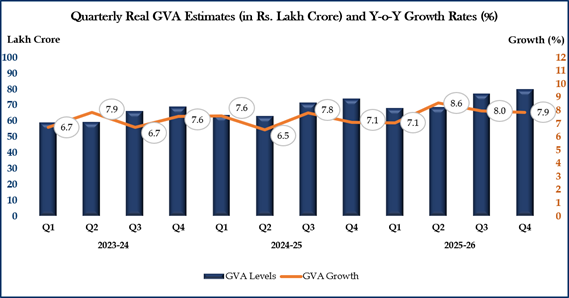
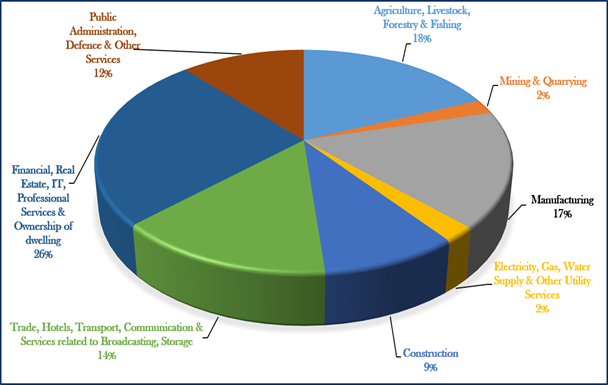
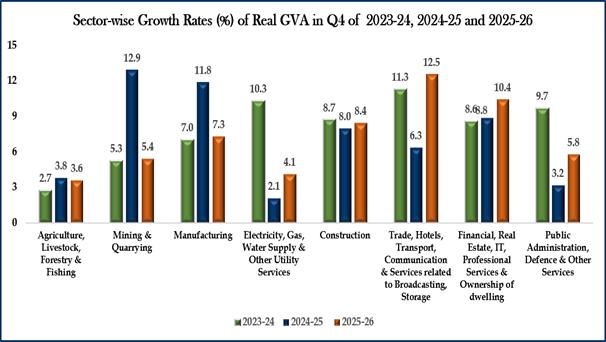
Fig. 5: Sectoral Composition and Growth Rates of Quarterly GVA
|
Sectoral Composition of Nominal GVA in Q4 of FY 2025-26
|
|
|
|
|
*Public Administration, Defence & Other Services category includes the Other Services sector i.e. Education, Health, Recreation, and other personal services
Fig. 6: Composition and Growth Rates of Quarterly GVA in Broad Sectors
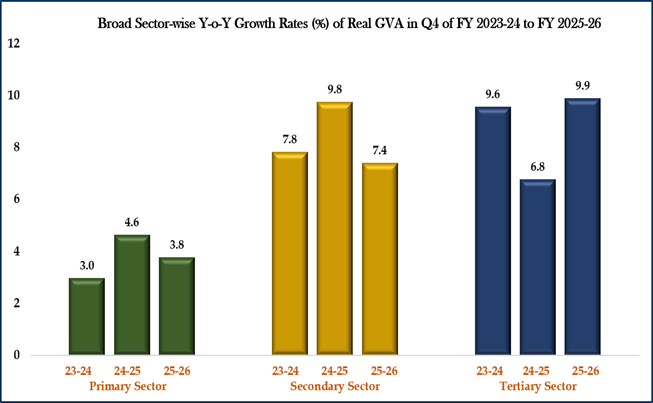
[Primary Sector: Agriculture, Livestock, Forestry & Fishing and Mining & Quarrying
Secondary Sector: Manufacturing; Electricity, Gas, Water supply & Other Utility Services and Construction
Tertiary Sector: Trade, Hotels, Transport, Communication and Services related to Broadcasting, Storage; Financial, Real Estate, IT, & Professional Services, Ownership of Dwelling and Public Administration, Defence & Other Services]
III. Methodology and Major Data Sources:
The compilation of Provisional Estimates (PE) of Annual GDP and Quarterly Estimates of GDP is based on Benchmark-Indicator methodology in which the estimates computed for the previous financial year are extrapolated using the relevant indicators reflecting the performance of various economic and institutional sectors. The Second Advance Estimate (SAE) of the Annual GDP for the FY 2025-26 released on 27th February, 2026 has mostly incorporated the information available upto Q3 of FY 2025-26. Subsequently, Sector-wise as well as Expenditure-side information have now been available for the Q4 of FY 2025-26 including the updated information on indicators for the previous quarters. Therefore, Provisional Estimates of GDP have been compiled based on aggregating all the quarterly estimates. The major indicators along with price indices used for the compilation of GDP are listed as follows,
Production-side Indicators and Price Indices:
- Advance Estimates of Crop Production
- Production of Inland and Marine Fish
- Season-wise Production of Major Livestock Products
- Index of Industrial Production (IIP)
- Index of Eight Core Industries
- Consumption of Natural Gas
- Financial Results of Listed Companies in BSE/NSE
- GST data
- Consumption of Steel
- Domestic Sales of Commercial Vehicles and Three Wheelers
- Domestic and International Air Traffic Statistics
- Railway Net Tonne, Passenger Km., Goods and Passenger earning information
- Cargo Handled at Major and Minor Ports
- Wireless Data Usage, Minutes of Usage, Internet Telephony, Telephone Subscribers, Revenue share from Calls and Data usage information
- Bank-wise Loan, Deposit, Interest information
- Loan, Deposit, Interest information of Non-Banking Financial Corporation
- Information on Revenue Account, Profit-Loss Account, Operating Expenses for Life and Non-Life Insurance companies
- Public Financial Management System (PFMS) data of Central Government
- Taxes, Subsidy information of State Governments from CAG
- Taxes, Subsidy information of Central Government from CGA
- Granular level Consumer Price Index (CPI)
- Granular level Wholesale Price Index (WPI)
Expenditure-side Indicators and Price Indices:
- Balance of Payment Table of RBI
- Vehicle category and class-wise Registration (from e-VAHAN) and Sales information
- Index of Industrial Production (IIP)
- Public Financial Management System (PFMS) data of Central Government
- Salary information of State Governments from CAG
- Principal Commodity and HSN-wise Import and Export of Goods
- Food Grain Offtake information
- Granular level Consumer Price Index (CPI)
- Granular level Wholesale Price Index (WPI)
- Principal Commodity-wise Unit Value Index (UVI)
The estimates of Quarterly GDP as per base year 2022-23 majorly follow the guidelines, standards as mentioned in Quarterly National Accounts Manual of International Monetary Fund (IMF), 2017. A brief of Revised Methodology, Data Sources, and Deflation strategy in the new series of quarterly GDP estimates with base year 2022-23 has been provided in the Press Note released on February, 2026. The Methodology and data sources used in the compilation will be presented comprehensively in the publication ‘Sources and Methods’ scheduled for its release by August, 2026.
The Annual and Quarterly National Accounts estimates will incorporate the revised IIP and WPI/PPI series with base year 2022-23, and the updated estimates will be released at the time of next press release of Quarterly GDP estimates for the First Quarter (April-June) of FY 2026-27 (Q1, 2026-27) scheduled on 31st August 2026.
IV. Statements
Annexure
Year-on-Year Growth Rate (%) in Indicators
|
Indicators
|
FY 2025-26
|
|
Q4
|
Annual
|
|
Total Food Grain Production
|
9.6
|
5.3
|
|
Cereals
|
10.5
|
5.2
|
|
Rice
|
10.7
|
2.6
|
|
Wheat
|
7.2
|
2.3
|
|
Cement Production Index
|
8.2
|
8.7
|
|
Finished Steel Consumption
|
10.4
|
8.0
|
|
Natural Gas Consumption
|
-2.8
|
-3.0
|
|
Sales of Commercial Vehicles
|
19.0
|
12.6
|
|
Sales of Three Wheelers
|
26.7
|
12.8
|
|
Cargo Handled at Major Ports
|
4.3
|
7.0
|
|
Cargo Handled at Minor Ports
|
-1.0
|
1.4
|
|
Air Passenger Traffic and Cargo handled (Scheduled Domestic Service)
|
3.7
|
3.7
|
|
Air Passenger Traffic and Cargo handled (Scheduled International Service)
|
11.1
|
9.7
|
|
Railway Net Tonne Km
|
1.9
|
1.4
|
|
Railway Passenger Km.
|
4.5
|
5.3
|
|
Central Goods and Services Tax (CGST)
|
9.0
|
6.4
|
|
Custom Duty
|
9.5
|
13.5
|
|
Union Excise
|
21.7
|
13.9
|
|
Fertilizer Subsidy (Urea + Nutrient based Fertilizer)
|
44.2
|
21.7
|
|
Household Vehicle Registration
|
28.7
|
17.4
|
|
Passenger Transport Vehicle Registration
|
19.8
|
14.7
|
|
Goods Transport Vehicles Registration
|
27.0
|
18.3
|
|
Export of Goods and Services
|
8.3
|
9.3
|
|
Import of Goods and Services
|
16.2
|
11.1
|
|
Import of Transport Goods
|
-1.9
|
6.0
|
|
Import of Machinery Equipment
|
24.9
|
19.3
|
|
WPI Food Grains
|
-3.1
|
-2.5
|
|
WPI Crude Petroleum and Natural Gas
|
8.3
|
-5.1
|
|
WPI Manufactured Products
|
3.0
|
2.3
|
Click here to download the PDF
*****
SAMRAT
(रिलीज़ आईडी: 2269286)
आगंतुक पटल : 19853