Ministry of Commerce & Industry
PRESS RELEASE ON NEW SERIES OF WHOLESALE PRICE INDEX, AND PRODUCER PRICE INDICES WITH BASE YEAR 2022-23
प्रविष्टि तिथि:
15 JUN 2026 12:00PM by PIB Delhi
The Office of Economic Adviser, DPIIT is releasing the revised series of WPI with base year 2022-23. The new series will replace the existing series of WPI with base year 2011-12. In addition, the Office is also releasing new series of Output Producer Price Index (OPPI), Trial Input Producer Price Index (IPPI), and Service Producer Price Index (Service PPI) of seven services, viz., Banking, Securities Transaction, Insurance, Management of Pension Funds, Railways, Air (Passenger), and Telecom with the same base year.
Considering the wide usage of WPI in price escalation clauses, this index will be released for five years from the date of its release, along with PPI, and will be discontinued thereafter. This would give sufficient time to users to switch from WPI to PPI. The transition from WPI to PPI is in alignment with the global best practices adopted by advanced economies and the recommendations of the International Monetary Fund (IMF). Availability of both the Output PPI and Input PPI gives a better understanding of the price movements of output produced vis-a-vis inputs being used in an industry. It also explains how inflation experienced by producers on inputs are passed on to the output being produced.
Service PPIs for seven services have been compiled in the first phase based on the availability of data from administrative sources/agencies.
WPI, and Output PPI, being compiled on a monthly basis, are being released for the month of May 2026 (Provisional Estimates). The back series of these indices are placed on the web portal of the Office of the Economic Adviser at weblink (https://eaindustry.nic.in/download_data_2223.asp). The monthly Trial Input PPI (only for Manufacturing Sector) is being published on an experimental basis March 2026 onwards. The publication of Trial Input PPI would enable the Department to examine the data quality and also receive feedback of stakeholders and users.
Service PPIs, compiled on a quarterly basis, are being released for Q4 of 2025-26 (Provisional). The back series of Service PPIs is placed on the web portal of the Office of the Economic Adviser at weblink (https://eaindustry.nic.in/download_data_2223.asp).
Key features of the new WPI series (Base Year 2022-23):
- Increased number of Items: The total number of items have increased from 697 to 957.
- Inclusion of New and Renewable Energy under Electricity: New sources of energy, such as Solar and Wind, have been added under ‘Electricity’ Group. In addition, Nuclear Electricity has been included in the basket.
- Coherent and Integrated Structure for Tracking Energy Prices: Crude Petroleum and Natural Gas has been shifted from ‘Primary Articles’ to ‘Fuel and Power’ major group. This reorganization has been done to ensure better alignment, as this group already houses other major fuels such as coal, electricity, and petroleum products.
- Improved Methodology for Derivation of Weights: Gross Value of Output (GVO) has been used for preparing weights for WPI 2022-23 series, compared to Net Traded Value i.e. GVO + Imports – Exports, used in WPI 2011-12 series. Weights derived on the basis of GVO represent the economic significance of commodities more accurately, as they reflect domestic production than the trade flows.
- Improved Computation Methodology: The elementary indices have been compiled using short-term formulation method, in place of long-term formulation method used in WPI 2011-12 series.
- Improved Method for Imputing Missing Price Data: In case of non-response or missing data, ‘Targeted Mean Imputation’ method has been used to impute missing prices in WPI 2022-23 series, compared to the ‘Carry Forward’ method followed in WPI 2011-12 series.
- Linking Factor: The Linking Factor has been computed as ratio of geometric means of the twelve-month indices of old and new series of WPI for the financial year 2024-25. At lower levels of disaggregation, the composition of the item basket has undergone significant changes, owing to the inclusion of new items and the removal of obsolete ones. Consequently, the derivation of linking factors at such granular levels may not yield reliable results. Linking Factor for linking 2011-12 series with 2022-23 series is given below: -
|
Major Group
|
Linking Factor
|
|
All Commodities
|
1.53
|
|
Primary Articles
|
1.71
|
|
Fuel and Power
|
1.65
|
|
Manufactured Products
|
1.44
|
While linking factors for All Commodities and Major Groups have been provided for reference, users are advised to exercise due caution while interpreting and comparing the indices across the two series. It may also be noted that, as a matter of policy, the Office of the Economic Adviser, DPIIT does not prescribe any specific methodology for linking or converting indices from one series to another. The selection of an appropriate linking approach is left to the discretion of users, depending on their analytical requirements and purposes.
Producer Price Indices (PPIs)
The weights for Output PPI and trial Input PPI have been derived using the Supply Table and Use Table respectively of Supply & Use Table (SUT) of National Accounts for the year 2022-23.
WPI, Output PPI and Service PPI are being compiled on the basis of Basic Price (which excludes Net Tax and Trade & Transport Margin), whereas trial Input PPI is being compiled using Purchaser’s Price since industries purchase input from market.
Release Schedule
Provisional indices of WPI, OPPI, and trial IPPI for a reference month will be released on the 14th of the following month (if it is a working day, else on next working day). Since new WPI series (Base Year 2022-23) is being released, index for old series (Base Year 2011-12) will be discontinued. Service PPIs for seven services will be released on a quarterly basis with a lag of 55 days from the closure of the reference quarter (if it is a working day, else on next working day).
Accordingly, release of WPI, Output PPI, and trial Input PPI for the month of June 2026 will be on Tuesday, 14th July 2026.
Service PPIs for seven services for Q1 of FY 2026-27 will be released on Monday, 24th August 2026.
For details pertaining to WPI, Output PPI, trial IPPI, and, Service PPIs, this press release is structured into four parts: -
|
Part A
|
Provisional Estimates of Wholesale Price Index (Base Year 2022-23) for the month of May 2026
|
|
Part B
|
Provisional Estimates of Output Producer Price Index (Base Year 2022-23) for the month of May 2026
|
|
Part C
|
- Provisional Estimates of Trial Input Producer Price Index (Base Year 2022-23) for the month of May 2026
|
|
Part D
|
Provisional Estimates of Service Producer Price Indices for Q4 of FY 2025-26
|
Part A-Provisional Estimates of Wholesale Price Index (Base Year 2022-23) for the Month of May 2026
Part A-Provisional Estimates of Wholesale Price Index (Base Year 2022-23) for the Month of May 2026
- Key highlights of WPI (Base Year 2022-23) for May 2026
- All India Wholesale Price Index (WPI) inflation for May 2026 is 9.68 per cent on year-on-year (YoY) basis, compared to 8.26 per cent in April 2026. The index for All Commodities for May 2026 stands at 109.9, whereas it was 108.8 in April 2026.
- Across Major Groups, YoY inflation for Primary Articles, Fuel and Power, and Manufactured Products is 4.99 per cent, 30.33 per cent, and 7.48 per cent, respectively in May 2026, whereas it was 3.78 per cent, 24.89 per cent, and 6.68 per cent, respectively, in April 2026. The indices for Primary Articles, Fuel and Power, and Manufactured Products are 113.7, 113, and 107.8, respectively, in May 2026, whereas they were 112.6, 110.9, and 107, respectively, in April 2026.
- Across Groups, ‘Mineral Oils (containing Petroleum Products)’, ‘Crude Petroleum and Natural Gas’, ‘Manufacture of Chemicals and Chemical Products’, and ‘Manufacture of Basic Metals’, have been major drivers of WPI inflation in April and May 2026.
- WPI Food Index (weight=24.99 per cent): The Food Index consists of ‘Food Articles’ from Primary Articles major group, and ‘Manufacture of Food Products’ from Manufactured Products major group. It observed a YoY inflation of 4.49 per cent in May 2026, compared to 3.11 per cent in April 2026.
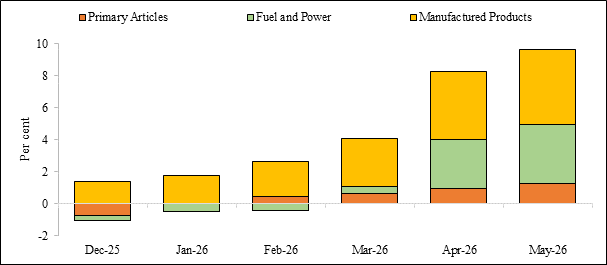
- Monthly indices and Inflation Rate (in per cent) for All commodities and Major Groups, along with major group-wise contribution for the past months are presented in the charts below.
Chart 1: WPI Index and Inflation Rate for All Commodities
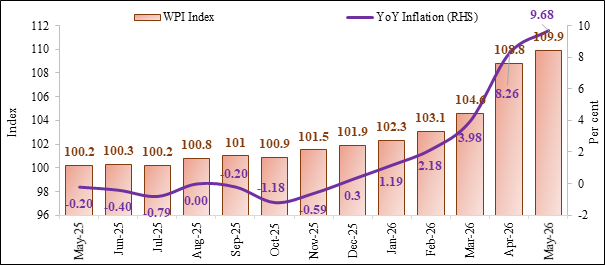
Chart 2: WPI Index of Major Groups
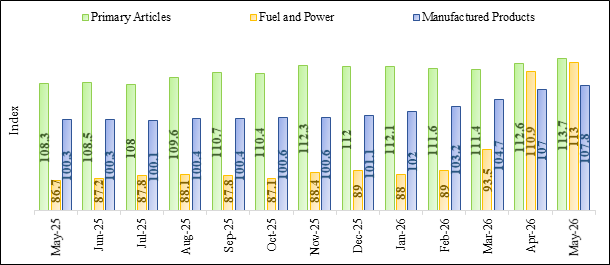
Chart 3: Inflation Rate across Major Groups
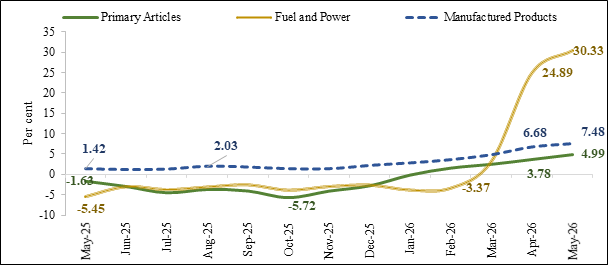
Chart 4: Major Group-Wise contribution to Inflation
- The Final Estimate of WPI (Base Year 2022-23) for the month of March 2026 has been compiled with a weighted response rate of 97.02 per cent.
- The Provisional Estimate of WPI (Base Year 2022-23) for the month of May 2026 has been compiled with a weighted response rate of 84.4 per cent.
- Wholesale Price Index, and Year-on-Year (YoY) Inflation Rate for All Commodities, Major Groups, and Groups for the last six months is given at Annexure-I and II.
- Annual WPI for All Commodities, Major Groups, and Groups for FY 2023-24, FY 2024-25, and FY 2025-26 are given at Annexure-III.
- YoY Inflation Rate for All Commodities, Major Groups, and Groups for FY 2024-25, and FY 2025-26 are given at Annexure- IV.
- Item-wise data pertaining to WPI (Base Year 2022-23) series from April 2023 to May 2026 is available at (https://eaindustry.nic.in/download_data_2223.asp).
Annexure-I
WPI for All Commodities, Major Groups and Groups for last six months
|
Groups/Major Groups
|
Weight
|
Dec-25 (F)
|
Jan-26 (F)
|
Feb-26 (F)
|
Mar-26 (F)
|
Apr-26 (P)
|
May-26 (P)
|
|
All Commodities
|
100.00000
|
101.9
|
102.3
|
103.1
|
104.6
|
108.8
|
109.9
|
|
I. Primary Articles
|
22.75730
|
112.0
|
112.1
|
111.6
|
111.4
|
112.6
|
113.7
|
|
(A). Food Articles
|
15.97835
|
114.5
|
113.9
|
113.1
|
112.8
|
114.0
|
115.0
|
|
(B). Non-Food Articles
|
5.52841
|
105.1
|
107
|
107.3
|
107.4
|
107.6
|
108.4
|
|
(C). Minerals
|
1.25054
|
111.4
|
111.1
|
112
|
110.8
|
117
|
119.7
|
|
II. Fuel and Power
|
14.11433
|
89.0
|
88.0
|
89.0
|
93.5
|
110.9
|
113.0
|
|
(A). Coal and Lignite
|
0.74136
|
86.7
|
86.2
|
86.5
|
87.8
|
87.7
|
86.6
|
|
(B). Mineral Oils
|
8.19208
|
86.0
|
84.6
|
85.8
|
92.9
|
121.6
|
125.7
|
|
(C). Electricity
|
4.46349
|
95.6
|
94.5
|
94.7
|
91.2
|
90.7
|
90.3
|
|
(D). Crude Petroleum & Natural Gas
|
0.71740
|
85.5
|
88.7
|
92.4
|
119.7
|
138.8
|
136.8
|
|
III. MANUFACTURED PRODUCTS
|
63.12837
|
101.1
|
102.0
|
103.2
|
104.7
|
107.0
|
107.8
|
|
(A). Manufacture of Food Products
|
9.02016
|
106.7
|
107.0
|
108.0
|
109.1
|
110.8
|
112.3
|
|
(B). Manufacture of Beverages
|
0.90483
|
102.5
|
102.9
|
102.6
|
102.7
|
104.5
|
105.3
|
|
(C). Manufacture of Tobacco Products
|
0.27645
|
110.8
|
110.6
|
122.7
|
122.6
|
124.2
|
123.7
|
|
(D). Manufacture of Textiles
|
4.08993
|
92.4
|
93.3
|
94.4
|
96.4
|
99.0
|
101.4
|
|
(E). Manufacture of Wearing Apparel
|
1.32948
|
110.4
|
109.9
|
109.8
|
109.9
|
110.8
|
112.2
|
|
(F). Manufacture of Leather and Related Products
|
0.54137
|
104.0
|
104.3
|
104.9
|
105.5
|
107.3
|
108.5
|
|
(G). Manufacture Of Wood and Products of Wood and Cork, except Furniture; Manufacture of Articles of Straw and Plaiting Materials
|
1.07718
|
109.3
|
109.9
|
110.0
|
112.1
|
114.8
|
116.1
|
|
(H). Manufacture of Paper and Paper Products
|
1.15328
|
89.9
|
90.1
|
90.6
|
91.4
|
93.6
|
93.9
|
|
(I). Printing and Reproduction of Recorded Media
|
0.42618
|
104.7
|
104.8
|
105.1
|
105.8
|
106.9
|
108.3
|
|
(J). Manufacture of Chemicals and Chemical Products
|
6.12567
|
90.4
|
91.0
|
91.8
|
96.5
|
101.9
|
102.4
|
|
(K). Manufacture of Basic Pharmaceutical Products and Pharmaceutical Preparations
|
2.20102
|
99.9
|
99.6
|
99.6
|
100.8
|
102.0
|
102.3
|
|
(L). Manufacture of Rubber and Plastic Products
|
2.71467
|
95.3
|
95.5
|
96.3
|
101.9
|
105.2
|
105.1
|
|
(M). Manufacture of Other Non-Metallic Mineral Products
|
2.84074
|
96.1
|
96.3
|
96.1
|
96.8
|
98.5
|
98.9
|
|
(N). Manufacture of Basic Metals
|
8.41133
|
91.8
|
95.2
|
98.0
|
100.1
|
103.4
|
104.1
|
|
(O). Manufacture of Fabricated Metal Products, except Machinery and Equipment
|
4.13294
|
100.1
|
100.9
|
102.0
|
102.7
|
104.5
|
105.8
|
|
(P). Manufacture of Computer, Electronic and Optical Products
|
2.07628
|
101.1
|
101.2
|
101.5
|
102.0
|
102.5
|
103.4
|
|
(Q). Manufacture of Electrical Equipment
|
2.64318
|
107.1
|
108.5
|
110.2
|
111.0
|
112.6
|
114.1
|
|
(R). Manufacture of Machinery and Equipment n.e.c.
|
3.46796
|
103.8
|
103.9
|
104.3
|
104.3
|
105.0
|
105.4
|
|
(S). Manufacture of Motor Vehicles, Trailers and Semi-Trailers
|
5.43645
|
105.5
|
105.9
|
106.4
|
105.9
|
108.3
|
108.5
|
|
(T). Manufacture of Other Transport Equipment
|
1.39511
|
105.2
|
105.1
|
105.2
|
105.4
|
106.2
|
106.6
|
|
(U). Manufacture of Furniture
|
0.82618
|
101.8
|
102.0
|
102.6
|
102.8
|
105.4
|
106.1
|
|
(V). Other Manufacturing
|
2.03798
|
147.7
|
152.4
|
156.4
|
158.8
|
158.7
|
158.8
|
|
Food Index
|
24.99851
|
111.7
|
111.4
|
111.3
|
111.5
|
112.8
|
114.0
|
(P)-Provisional, (F)-Final
Annexure-II
WPI Inflation Rate (YoY) for All Commodities, Major Groups, and Groups for last six months
|
Groups/Major Groups
|
Weight
|
Dec-25 (F)
|
Jan-26 (F)
|
Feb-26 (F)
|
Mar-26 (F)
|
Apr-26 (P)
|
May-26 (P)
|
|
All Commodities
|
100.00000
|
0.30
|
1.19
|
2.18
|
3.98
|
8.26
|
9.68
|
|
I. Primary Articles
|
22.75730
|
-2.78
|
-0.09
|
1.64
|
2.58
|
3.78
|
4.99
|
|
(A). Food Articles
|
15.97835
|
-4.42
|
-1.30
|
0.80
|
1.53
|
2.43
|
3.60
|
|
(B). Non-Food Articles
|
5.52841
|
2.74
|
3.98
|
4.68
|
6.65
|
7.6
|
9.49
|
|
(C). Minerals
|
1.25054
|
-1.68
|
-0.45
|
1.36
|
0.09
|
6.36
|
4.91
|
|
II. Fuel and Power
|
14.11433
|
-2.63
|
-3.83
|
-3.37
|
3.20
|
24.89
|
30.33
|
|
(A). Coal and Lignite
|
0.74136
|
-3.13
|
-3.90
|
-2.37
|
-0.79
|
-1.57
|
-2.26
|
|
(B). Mineral Oils
|
8.19208
|
-1.94
|
-4.19
|
-4.35
|
4.26
|
40.74
|
49.82
|
|
(C). Electricity
|
4.46349
|
-2.75
|
-2.28
|
-1.56
|
-2.04
|
-2.68
|
-1.85
|
|
(D). Crude Petroleum & Natural Gas
|
0.71740
|
-8.26
|
-9.95
|
-5.33
|
26.13
|
56.31
|
61.51
|
|
III. Manufactured Products
|
63.12837
|
2.22
|
2.82
|
3.61
|
4.80
|
6.68
|
7.48
|
|
(A). Manufacture of Food Products
|
9.02016
|
1.14
|
1.61
|
2.08
|
2.54
|
4.53
|
6.14
|
|
(B). Manufacture of Beverages
|
0.90483
|
-1.63
|
-1.06
|
-0.68
|
-0.68
|
0.48
|
1.64
|
|
(C). Manufacture of Tobacco Products
|
0.27645
|
2.50
|
2.03
|
12.57
|
11.86
|
13.63
|
13.59
|
|
(D). Manufacture of Textiles
|
4.08993
|
0
|
0.97
|
1.94
|
4.90
|
7.14
|
10.22
|
|
(E). Manufacture of Wearing Apparel
|
1.32948
|
3.95
|
3.78
|
3.39
|
2.90
|
2.88
|
4.28
|
|
(F). Manufacture of Leather and Related Products
|
0.54137
|
2.36
|
2.05
|
2.64
|
3.23
|
3.87
|
4.33
|
|
(G). Manufacture of Wood and Products of Wood and Cork, except Furniture; Manufacture of Articles of Straw and Plaiting Materials
|
1.07718
|
3.60
|
3.10
|
3.00
|
5.06
|
7.69
|
7.60
|
|
(H). Manufacture of Paper and Paper Products
|
1.15328
|
-0.11
|
-0.88
|
-0.66
|
0.11
|
2.07
|
2.74
|
|
(I). Printing and Reproduction of Recorded Media
|
0.42618
|
0.96
|
1.16
|
1.55
|
2.12
|
2.99
|
4.13
|
|
(J). Manufacture of Chemicals and Chemical Products
|
6.12567
|
-0.44
|
-0.33
|
0.22
|
5.70
|
12.22
|
13.40
|
|
(K). Manufacture of Basic Pharmaceutical Products and Pharmaceutical Preparations
|
2.20102
|
0
|
0.10
|
0.30
|
1.10
|
2.31
|
3.33
|
|
(L). Manufacture of Rubber and Plastic Products
|
2.71467
|
-1.35
|
-1.24
|
-0.72
|
5.38
|
9.24
|
9.59
|
|
(M). Manufacture of Other Non-Metallic Mineral Products
|
2.84074
|
-0.31
|
-0.31
|
-0.93
|
-0.10
|
1.23
|
1.02
|
|
(N). Manufacture of Basic Metals
|
8.41133
|
1.44
|
5.19
|
7.34
|
8.57
|
10.59
|
12.30
|
|
(O). Manufacture of Fabricated Metal Products, except Machinery and Equipment
|
4.13294
|
1.52
|
2.54
|
2.82
|
3.42
|
5.13
|
6.22
|
|
(P). Manufacture of Computer, Electronic and Optical Products
|
2.07628
|
4.23
|
1.30
|
0.89
|
-0.58
|
-0.39
|
-0.19
|
|
(Q). Manufacture of Electrical Equipment
|
2.64318
|
4.79
|
6.69
|
7.62
|
7.98
|
9.11
|
11.32
|
|
(R). Manufacture of Machinery and Equipment n.e.c.
|
3.46796
|
1.07
|
0.78
|
1.26
|
1.07
|
1.74
|
2.33
|
|
(S). Manufacture of Motor Vehicles, Trailers and Semi-Trailers
|
5.43645
|
0.86
|
0.38
|
1.82
|
0.95
|
2.36
|
2.17
|
|
(T). Manufacture of Other Transport Equipment
|
1.39511
|
2.94
|
2.34
|
1.74
|
1.93
|
3.41
|
4.31
|
|
(U). Manufacture of Furniture
|
0.82618
|
-0.59
|
-0.58
|
-0.10
|
0.19
|
3.64
|
5.68
|
|
(V). Other Manufacturing
|
2.03798
|
33.06
|
32.52
|
31.54
|
32.89
|
27.57
|
21.87
|
|
Food Index
|
24.99851
|
-2.53
|
-0.36
|
1.27
|
1.92
|
3.11
|
4.49
|
(P)-Provisional, (F)-Final
Annexure-III
Annual WPI for All Commodities, Major Groups, and Groups
|
Groups/Major Groups
|
Weight
|
2023-24
|
2024-25
|
2025-26
|
|
All Commodities
|
100.00000
|
99.3
|
101.0
|
101.4
|
|
I. Primary Articles
|
22.75730
|
106.4
|
112.8
|
110.3
|
|
(A). Food Articles
|
15.97835
|
108.9
|
117.1
|
112.8
|
|
(B). Non-Food Articles
|
5.52841
|
99.8
|
100.1
|
102.5
|
|
(C). Minerals
|
1.25054
|
103.7
|
113.0
|
112.4
|
|
II. Fuel and Power
|
14.11433
|
93.0
|
91.1
|
88.5
|
|
(A). Coal and Lignite
|
0.74136
|
92.1
|
89.8
|
87.9
|
|
(B). Mineral Oils
|
8.19208
|
91.1
|
88.8
|
85.9
|
|
(C). Electricity
|
4.46349
|
95.8
|
94.4
|
92.8
|
|
(D). Crude Petroleum & Natural Gas
|
0.71740
|
98.3
|
97.5
|
91
|
|
III. Manufactured Products
|
63.12837
|
98.1
|
99.0
|
101.2
|
|
(A). Manufacture of Food Products
|
9.02016
|
98.7
|
103.5
|
106.8
|
|
(B). Manufacture of Beverages
|
0.90483
|
102.7
|
103.8
|
103.4
|
|
(C). Manufacture of Tobacco Products
|
0.27645
|
104.9
|
107.6
|
112.2
|
|
(D). Manufacture of Textiles
|
4.08993
|
92.2
|
92.5
|
92.9
|
|
(E). Manufacture of Wearing Apparel
|
1.32948
|
102.7
|
105.5
|
109.2
|
|
(F). Manufacture of Leather and Related Products
|
0.54137
|
101.3
|
102.1
|
104.4
|
|
(G). Manufacture of Wood and Products of Wood and Cork, except Furniture; Manufacture of Articles of Straw and Plaiting Materials
|
1.07718
|
102.8
|
104.7
|
108.9
|
|
(H). Manufacture of Paper and Paper Products
|
1.15328
|
89.5
|
90.4
|
90.9
|
|
(I). Printing and Reproduction of Recorded Media
|
0.42618
|
103.8
|
104.2
|
104.8
|
|
(J). Manufacture of Chemicals and Chemical Products
|
6.12567
|
92.1
|
91.2
|
91.3
|
|
(K). Manufacture of Basic Pharmaceutical Products and Pharmaceutical Preparations
|
2.20102
|
101.0
|
99.7
|
99.7
|
|
(L). Manufacture of Rubber and Plastic Products
|
2.71467
|
94.8
|
96.5
|
96.5
|
|
(M). Manufacture of Other Non-Metallic Mineral Products
|
2.84074
|
99.2
|
96.0
|
96.9
|
|
(N). Manufacture of Basic Metals
|
8.41133
|
93.5
|
92.2
|
93.2
|
|
(O). Manufacture of Fabricated Metal Products, except Machinery and Equipment
|
4.13294
|
99.9
|
99.3
|
100.2
|
|
(P). Manufacture of Computer, Electronic and Optical Products
|
2.07628
|
97.6
|
98.2
|
102.3
|
|
(Q). Manufacture of Electrical Equipment
|
2.64318
|
100.5
|
102.2
|
105.9
|
|
(R). Manufacture of Machinery and Equipment n.e.c.
|
3.46796
|
102.0
|
102.6
|
103.6
|
|
(S). Manufacture of Motor Vehicles, Trailers and Semi-Trailers
|
5.43645
|
104.7
|
105.5
|
105.7
|
|
(T). Manufacture of Other Transport Equipment
|
1.39511
|
101.7
|
101.8
|
104.1
|
|
(U). Manufacture of Furniture
|
0.82618
|
101.3
|
102.1
|
101.4
|
|
(V). Other Manufacturing
|
2.03798
|
105.5
|
113.1
|
138.2
|
|
Food Index
|
24.99851
|
105.2
|
112.2
|
110.6
|
Note: Annual Index has been calculated by taking Arithmetic Mean of 12 months indices
Annexure-IV
Annual WPI Inflation Rate (YoY) for All Commodities, Major Groups, and Groups
|
Groups/Major Groups
|
Weight
|
2024-25
|
2025-26
|
|
All Commodities
|
100.00000
|
1.74
|
0.40
|
|
I. Primary Articles
|
22.75730
|
5.93
|
-2.19
|
|
(A). Food Articles
|
15.97835
|
7.51
|
-3.67
|
|
(B). Non-Food Articles
|
5.52841
|
0.27
|
2.41
|
|
(C). Minerals
|
1.25054
|
9.03
|
-0.60
|
|
II. Fuel and Power
|
14.11433
|
-2.05
|
-2.90
|
|
(A). Coal and Lignite
|
0.74136
|
-2.58
|
-2.10
|
|
(B). Mineral Oils
|
8.19208
|
-2.51
|
-3.28
|
|
(C). Electricity
|
4.46349
|
-1.41
|
-1.70
|
|
(D). Crude Petroleum & Natural Gas
|
0.71740
|
-0.76
|
-6.71
|
|
III. Manufactured Products
|
63.12837
|
0.90
|
2.16
|
|
(A). Manufacture of Food Products
|
9.02016
|
4.86
|
3.22
|
|
(B). Manufacture of Beverages
|
0.90483
|
1.11
|
-0.42
|
|
(C). Manufacture of Tobacco Products
|
0.27645
|
2.58
|
4.27
|
|
(D). Manufacture of Textiles
|
4.08993
|
0.33
|
0.47
|
|
(E). Manufacture of Wearing Apparel
|
1.32948
|
2.79
|
3.46
|
|
(F). Manufacture of Leather and Related Products
|
0.54137
|
0.73
|
2.29
|
|
(G). Manufacture of Wood and Products of Wood and Cork, except Furniture; Manufacture of Articles of Straw and Plaiting Materials
|
1.07718
|
1.92
|
3.95
|
|
(H). Manufacture of Paper and Paper Products
|
1.15328
|
1.02
|
0.55
|
|
(I). Printing and Reproduction of Recorded Media
|
0.42618
|
0.37
|
0.58
|
|
(J). Manufacture of Chemicals and Chemical Products
|
6.12567
|
-1.06
|
0.12
|
|
(K). Manufacture of Basic Pharmaceutical Products and Pharmaceutical Preparations
|
2.20102
|
-1.24
|
-0.03
|
|
(L). Manufacture of Rubber and Plastic Products
|
2.71467
|
1.78
|
0.00
|
|
(M). Manufacture of Other Non-Metallic Mineral Products
|
2.84074
|
-3.19
|
0.86
|
|
(N). Manufacture of Basic Metals
|
8.41133
|
-1.34
|
1.01
|
|
(O). Manufacture of Fabricated Metal Products, except Machinery and Equipment
|
4.13294
|
-0.54
|
0.91
|
|
(P). Manufacture of Computer, Electronic and Optical Products
|
2.07628
|
0.61
|
4.11
|
|
(Q). Manufacture of Electrical Equipment
|
2.64318
|
1.72
|
3.64
|
|
(R). Manufacture of Machinery and Equipment n.e.c.
|
3.46796
|
0.60
|
0.98
|
|
(S). Manufacture of Motor Vehicles, Trailers and Semi-Trailers
|
5.43645
|
0.72
|
0.21
|
|
(T). Manufacture of Other Transport Equipment
|
1.39511
|
0.08
|
2.25
|
|
(U). Manufacture of Furniture
|
0.82618
|
0.77
|
-0.72
|
|
(V). Other Manufacturing
|
2.03798
|
7.16
|
22.22
|
|
Food Index
|
24.99851
|
6.62
|
-1.37
|
Part B-Provisional Estimates of Output Producer Price Index (Base Year 2022-23) for the month of May 2026
Part B-Provisional Estimates of Output Producer Price Index (Base Year 2022-23) for the month of May 2026
- Key highlights of OPPI (Base Year 2022-23) for May 2026
- All India Output PPI for All Commodities for May 2026 stands at 109.6, whereas it was 108.6 in April 2026.
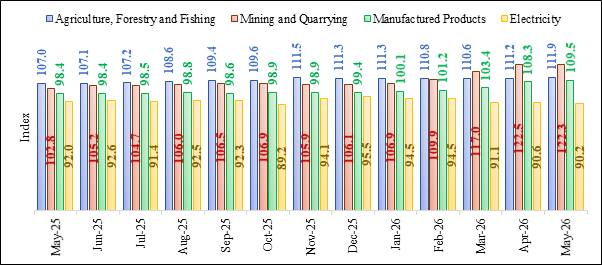
- Across Major Groups, indices for Agriculture, Forestry and Fishing; Mining and Quarrying; Manufactured Products; and Electricity are 111.9, 122.3, 109.5, and 90.2, respectively, in May 2026, whereas they were 111.2, 122.5, 108.3, and, 90.6 respectively, in April 2026.
- Monthly indices for All Commodities and Major Groups, for the past 13 months are presented in the charts below.
Chart 5: Output PPI for All Commodities
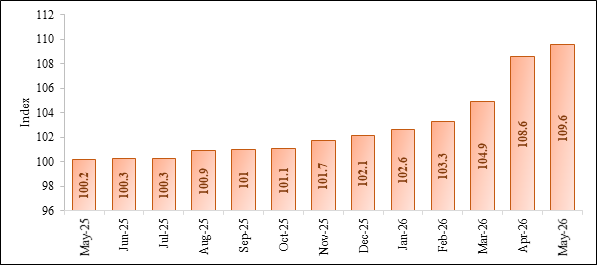
Chart 6: Output PPI across Major Groups
- Output PPI for All Commodities, Major Groups, and Groups for the last six months is given at Annexure-V.
- Annual Output PPI for All Commodities, Major Groups, and Groups for FY 2023-24, FY 2024-25, and FY 2025-26 is given at Annexure-VI.
- SUT category-wise index pertaining to Output PPI (Base Year 2022-23) series from April 2023 to May 2026 is available at (https://eaindustry.nic.in/download_data_2223.asp).
Annexure-V
Output PPI for All Commodities, Major Groups and Groups for last six months
|
Groups/Major Groups
|
Weight
|
Dec-25 (F)
|
Jan-26 (F)
|
Feb-26 (F)
|
Mar-26 (F)
|
Apr-26 (P)
|
May-26 (P)
|
|
ALL COMMODITIES
|
100.00000
|
102.1
|
102.6
|
103.3
|
104.9
|
108.6
|
109.6
|
|
AGRICULTURE, FORESTRY AND FISHING
|
22.15648
|
111.3
|
111.3
|
110.8
|
110.6
|
111.2
|
111.9
|
|
Crop and Animal Production, Hunting and Related Service Activities
|
19.03219
|
111.9
|
111.7
|
111.3
|
111
|
111.3
|
111.8
|
|
Forestry and Logging
|
1.67481
|
114.6
|
114.4
|
115
|
115.4
|
116.7
|
117.2
|
|
Fishing and Aquaculture
|
1.44948
|
99.0
|
102.7
|
99.3
|
100.1
|
103.2
|
106.9
|
|
MINING AND QUARRYING
|
3.42065
|
106.1
|
106.9
|
109.9
|
117
|
122.5
|
122.3
|
|
Mining of Metal Ores
|
0.70792
|
153.4
|
158.6
|
168
|
171.5
|
169.6
|
174.8
|
|
Mining of Coal and Lignite
|
0.73980
|
86.7
|
86.2
|
86.5
|
87.8
|
87.7
|
86.6
|
|
Other Mining and Quarrying
|
1.23208
|
106.2
|
103.2
|
103.2
|
100.5
|
105.1
|
105.2
|
|
Extraction of Crude Petroleum and Natural Gas
|
0.74085
|
80.2
|
84.5
|
88.9
|
121.7
|
141
|
136.2
|
|
MANUFACTURED PRODUCTS
|
69.93568
|
99.4
|
100.1
|
101.2
|
103.4
|
108.3
|
109.5
|
|
(A). Manufacture of Food Products
|
8.47196
|
107.1
|
107.5
|
108.3
|
109.2
|
110.8
|
112.2
|
|
(B). Manufacture of Beverages
|
0.84170
|
102.7
|
103.1
|
102.7
|
102.8
|
104.6
|
105.5
|
|
(C). Manufacture of Tobacco Products
|
0.25705
|
112.0
|
111.9
|
125.9
|
125.9
|
127.0
|
126.7
|
|
(D). Manufacture of Textiles
|
4.38774
|
92.9
|
93.7
|
95.0
|
97.8
|
100.9
|
103.1
|
|
(E). Manufacture of Wearing Apparel
|
1.20494
|
109.4
|
108.8
|
108.7
|
108.7
|
109.6
|
111.2
|
|
(F). Manufacture of Leather and Related Products
|
0.49989
|
103.2
|
103.1
|
103.6
|
104.2
|
106.1
|
107.2
|
|
(G). Manufacture of Wood and Products of Wood and Cork, except Furniture; Manufacture of Articles of Straw and Plaiting Materials
|
1.08949
|
107.6
|
108.1
|
108.3
|
110.3
|
113.0
|
114.4
|
|
(H). Manufacture of Paper and Paper Products
|
1.03128
|
90.2
|
90.3
|
90.7
|
91.6
|
93.8
|
94.1
|
|
(I). Printing and Reproduction of Recorded Media
|
0.30931
|
105.7
|
105.6
|
106.1
|
107.1
|
108.1
|
109.4
|
|
(J). Manufacture of Coke and Refined Petroleum Products
|
7.14818
|
85.9
|
84.5
|
85.7
|
92.7
|
121
|
125.1
|
|
(K). Manufacture of Chemicals and Chemical Products
|
5.74793
|
90.7
|
91.5
|
92.2
|
97.3
|
102.6
|
102.7
|
|
(L). Manufacture of Basic Pharmaceuticals, Medicinal Chemical and Botanical Products
|
1.92807
|
100.8
|
100.7
|
100.6
|
101.8
|
102.9
|
103.1
|
|
(M). Manufacture of Rubber and Plastic Products
|
2.57252
|
95.7
|
95.9
|
96.9
|
102.5
|
105.8
|
105.7
|
|
(N). Manufacture of Other Non-Metallic Mineral Products
|
2.50437
|
95.6
|
96.0
|
95.8
|
96.4
|
98.4
|
98.7
|
|
(O). Manufacture of Basic Metals
|
7.46500
|
90.8
|
94.3
|
96.6
|
99.0
|
103.1
|
103.9
|
|
(P). Manufacture of Fabricated Metal Products, except Machinery and Equipment
|
3.15198
|
98.5
|
99.3
|
100.4
|
101.1
|
102.5
|
103.6
|
|
(Q). Manufacture of Computer, Electronic and Optical Products
|
1.77480
|
103.9
|
104.4
|
104.6
|
104.6
|
105.0
|
106.0
|
|
(R). Manufacture of Electrical Equipment
|
3.81453
|
102.7
|
103.1
|
104.0
|
104.4
|
105.6
|
107.1
|
|
(S). Manufacture of Machinery and Equipment n.e.c.
|
2.46158
|
104.1
|
104.1
|
104.7
|
104.8
|
105.5
|
105.7
|
|
(T). Manufacture of Motor Vehicles, Trailers and Semi-Trailers
|
4.39321
|
105.9
|
106.4
|
106.9
|
106.6
|
108.7
|
108.8
|
|
(U). Manufacture of Other Transport Equipment
|
1.34392
|
105.4
|
106.0
|
106.1
|
106.4
|
107.1
|
107.5
|
|
(V). Manufacture of Furniture
|
0.73566
|
103.1
|
102.9
|
103.2
|
103.7
|
105.2
|
105.2
|
|
(W). Other Manufacturing
|
6.80057
|
114.1
|
115.9
|
118.3
|
119.9
|
121.1
|
122.0
|
|
ELECTRICITY
|
4.48719
|
95.5
|
94.5
|
94.5
|
91.1
|
90.6
|
90.2
|
|
Electricity
|
4.48719
|
95.5
|
94.5
|
94.5
|
91.1
|
90.6
|
90.2
|
(P)-Provisional, (F)-Final
Annexure-VI
Annual Output PPI for All Commodities, Major Groups and Groups
|
Groups/Major Groups
|
Weights
|
2023-24
|
2024-25
|
2025-26
|
|
ALL COMMODITIES
|
100.00000
|
99.2
|
100.9
|
101.6
|
|
AGRICULTURE, FORESTRY AND FISHING
|
22.15648
|
106.3
|
111.3
|
109.3
|
|
Crop and Animal Production, Hunting and Related Service Activities
|
19.03219
|
106.7
|
111.8
|
109.7
|
|
Forestry and Logging
|
1.67481
|
106.1
|
114.2
|
113.1
|
|
Fishing and Aquaculture
|
1.44948
|
100.6
|
101.3
|
100.6
|
|
MINING AND QUARRYING
|
3.42065
|
100.2
|
105
|
106.7
|
|
Mining of Metal Ores
|
0.70792
|
107.5
|
127.4
|
151
|
|
Mining of Coal and Lignite
|
0.73980
|
92.1
|
89.8
|
87.9
|
|
Other Mining and Quarrying
|
1.23208
|
104.0
|
108.5
|
104.6
|
|
Extraction of Crude Petroleum and Natural Gas
|
0.74085
|
94.7
|
93.2
|
86.7
|
|
MANUFACTURED PRODUCTS
|
69.93568
|
97.2
|
97.8
|
99.4
|
|
(A). Manufacture of Food Products
|
8.47196
|
97.8
|
103.3
|
107.1
|
|
(B). Manufacture of Beverages
|
0.84170
|
102.8
|
104.0
|
103.6
|
|
(C). Manufacture of Tobacco Products
|
0.25705
|
104.5
|
107.6
|
113.1
|
|
(D). Manufacture of Textiles
|
4.38774
|
92.4
|
92.7
|
93.4
|
|
(E). Manufacture of Wearing Apparel
|
1.20494
|
102.2
|
104.7
|
108.1
|
|
(F). Manufacture of Leather and Related Products
|
0.49989
|
100.6
|
101.3
|
103.1
|
|
(G). Manufacture of Wood and Products of Wood and Cork, except Furniture; Manufacture of Articles of Straw and Plaiting Materials
|
1.08949
|
102.3
|
104.0
|
107.5
|
|
(H). Manufacture of Paper and Paper Products
|
1.03128
|
89.4
|
90.5
|
91.1
|
|
(I). Printing and Reproduction of Recorded Media
|
0.30931
|
104.3
|
104.7
|
105.8
|
|
(J). Manufacture of Coke and Refined Petroleum Products
|
7.14818
|
91.1
|
88.8
|
85.8
|
|
(K). Manufacture of Chemical and Chemical Products
|
5.74793
|
92.2
|
91.4
|
91.7
|
|
(L). Manufacture of Basic Pharmaceuticals, Medicinal Chemical and Botanical Products
|
1.92807
|
101.1
|
99.3
|
100.5
|
|
(M). Manufacture of Rubber and Plastic Products
|
2.57252
|
94.9
|
96.5
|
96.8
|
|
(N). Manufacture of Other Non-Metallic Mineral Products
|
2.50437
|
98.9
|
95.7
|
96.4
|
|
(O). Manufacture of Basic Metals
|
7.46500
|
93.3
|
92.1
|
92.3
|
|
(P). Manufacture of Fabricated Metal Products, except Machinery and Equipment
|
3.15198
|
98.4
|
99.0
|
98.8
|
|
(Q). Manufacture of Computer, Electronic and Optical Products
|
1.77480
|
96.6
|
99.2
|
105.3
|
|
(R). Manufacture of Electrical Equipment
|
3.81453
|
99.3
|
99.7
|
102.0
|
|
(S). Manufacture of Machinery and Equipment n.e.c.
|
2.46158
|
102.3
|
102.8
|
103.9
|
|
(T). Manufacture of Motor Vehicles, Trailers and Semi-Trailers
|
4.39321
|
105.1
|
105.6
|
106.1
|
|
(U). Manufacture of Other Transport Equipment
|
1.34392
|
102.1
|
102.0
|
104.8
|
|
(V). Manufacture of Furniture
|
0.73566
|
101.4
|
101.8
|
102.0
|
|
(W). Other Manufacturing
|
6.80057
|
101.3
|
103.3
|
111.4
|
|
ELECTRICITY
|
4.48719
|
95.8
|
94.4
|
92.7
|
|
Electricity
|
4.48719
|
95.8
|
94.4
|
92.7
|
Note: Annual Index has been calculated by taking Arithmetic Mean of 12 months indices
Part C-Provisional Estimates of Trial Input Producer Price Index (Base Year 2022-23) for the month of May 2026
Part C-Provisional Estimates of Trial Input Producer Price Index (IPPI) (Base Year 2022-23) for the month of May 2026
- All India trial Input PPI for Manufacturing Sector for May 2026 stands at 104.9.
- Trial Input PPI for all Manufacturing Industries at NIC-2-digit, for the months of March, April and May 2026 is given below.
Trial Input PPI for all Manufacturing Industries at NIC-2-digit
|
Industry Group
|
Weight
|
Mar-26 (F)
|
Apr-26 (P)
|
May-26 (P)
|
|
Manufacturing Sector
|
100.00000
|
100.9
|
104.9
|
104.9
|
|
(A). Manufacture of Food Products
|
14.84638
|
107.1
|
108.1
|
110.5
|
|
(B). Manufacture of Beverages
|
1.03035
|
106.0
|
104.6
|
104.8
|
|
(C). Manufacture of Tobacco Products
|
0.26443
|
128.0
|
124.9
|
125.7
|
|
(D). Manufacture of Textiles
|
5.88918
|
95.5
|
100.8
|
103.1
|
|
(E). Manufacture of Wearing Apparel
|
1.57012
|
105.6
|
106.4
|
108.3
|
|
(F). Manufacture of Leather and Related Products
|
0.77634
|
96.3
|
96.0
|
96.2
|
|
(G). Manufacture of Wood and Products of Wood and Cork, Except Furniture; Manufacture of Articles of Straw and Plaiting Materials
|
1.82194
|
99.7
|
110.3
|
110.8
|
|
(H). Manufacture of Paper and Paper Products
|
0.87494
|
95.1
|
96.9
|
97.1
|
|
(I). Printing and Reproduction of Recorded Media
|
0.46606
|
96.4
|
98.2
|
101.2
|
|
(J). Manufacture of Coke and Refined Petroleum Products
|
12.32910
|
98.2
|
112.1
|
105.8
|
|
(K). Manufacture of Chemicals and Chemical Products
|
7.98919
|
100.9
|
107.4
|
111.8
|
|
(L). Manufacture of Basic Pharmaceutical Products and Pharmaceutical Preparations
|
2.40463
|
98.2
|
103.0
|
104.9
|
|
(M). Manufacture of Rubber and Plastic Products
|
3.40235
|
105.9
|
110.4
|
111.9
|
|
(N). Manufacture of Other Non-Metallic Mineral Products
|
3.28306
|
92.3
|
95.8
|
93.2
|
|
(O). Manufacture of Basic Metals
|
11.25229
|
98.3
|
100.8
|
98.5
|
|
(P). Manufacture of Fabricated Metal Products, except Machinery and Equipment
|
5.59239
|
99.7
|
101.5
|
103.9
|
|
(Q). Manufacture of Computer, Electronic and Optical Products
|
2.22964
|
108.0
|
108.3
|
108.4
|
|
(R). Manufacture of Electrical Equipment
|
3.64437
|
111.5
|
113.2
|
115.8
|
|
(S). Manufacture of Machinery and Equipment n.e.c.
|
5.07784
|
102.2
|
103.9
|
102.7
|
|
(T). Manufacture of Motor Vehicles, Trailers and Semi-Trailers, and Manufacture of Other Transport Equipment
|
10.49446
|
101.5
|
102.8
|
104.1
|
|
(U). Manufacture of Furniture
|
0.98353
|
97.6
|
101.0
|
101.6
|
|
(V). Other Manufacturing
|
3.77741
|
88.9
|
88.2
|
83.1
|
(P)-Provisional, (F)-Final
Part D-Provisional Estimates of Service Producer Price Indices (Base Year 2022-23) for Q4 of FY 2025-26
Part D-Provisional Estimates of Service PPIs (Base Year 2022-23) for Q4 of FY 2025-26
The Office of the Economic Adviser (OEA), Department for Promotion of Industry and Internal Trade (DPIIT), M/o Commerce & Industry, has started the compilation of Service Producer Price Index (SPPI) in a phased manner. In first phase, the indices of seven services are compiled using the data from administrative/institutional sources, and will be released quarterly.
- The Provisional Estimates of Service Producer Price Indices for Q4 of FY 2025-26 and Final Estimates for Q3 of FY 2025-26 are as below: -
|
S. No.
|
Service PPI
|
Q3: 2025-26 (F)
|
Q4: 2025-26 (P)
|
|
1.
|
Securities Transaction Service Price Index
|
89.2
|
91.7
|
|
2.(a)
|
Banking Service Price Index
|
102.2
|
100.9
|
|
2.(b)
|
Banking Service Contribution Index
|
132.0
|
129.7
|
|
3.
|
Management of Pension Funds Service Price Index
|
106.3
|
103.8
|
|
4.
|
Insurance Service Price Index
|
102.0
|
102.8
|
|
5.
|
Telecom Service Price Index
|
112.2
|
112.2
|
|
6.
|
Railway Service Price Index
|
102.6
|
103.3
|
|
6.(a)
|
Railway Freight Service Price Index
|
103.2
|
103.2
|
|
6.(b)
|
Railway Passenger Service Price Index
|
101.3
|
103.5
|
|
7.
|
Air (Passenger) Service Price Index
|
107.3
|
106.9
|
(P)-Provisional, (F)-Final
Note: Weights have not been assigned to aforementioned services as these services do not cover the entire service sector. However, sub-service level weights under each service, have been computed using the data of FY 2022-23 for arriving at the PPI of respective Services.
- Annual Service Producer Price Indices (Base Year 2022-23) for FY 2023-24, FY 2024-25, and FY 2025-26 are given at Annexure-VII.
- Quarterly Service PPIs from Q1 of FY 2023-24 to Q4 of FY 2025-26 are available at (https://eaindustry.nic.in/download_data_2223.asp).
Annexure-VII
Annual Service PPIs
|
S.No.
|
Service PPI
|
2023-24
|
2024-25
|
2025-26 (P)
|
|
1
|
Securities Transaction Service Price Index
|
106.7
|
95.9
|
91.1
|
|
2.(a)
|
Banking Service Price Index
|
104.9
|
106.3
|
102.8
|
|
2.(b)
|
Banking Service Contribution Index
|
115.8
|
126.4
|
129.4
|
|
3.
|
Management of Pension Funds Service Price Index
|
101.6
|
105.6
|
106.6
|
|
4.
|
Insurance Service Price Index
|
99.9
|
102.6
|
102.4
|
|
5.
|
Telecom Service Price Index
|
102.5
|
109.3
|
111.9
|
|
6.
|
Railway Service Price Index
|
101.3
|
102
|
102.3
|
|
6.(a)
|
Railway Freight Service Price Index
|
102.0
|
103.0
|
102.7
|
|
6.(b)
|
Railway Passenger Service Price Index
|
100.0
|
100.0
|
101.5
|
|
7.
|
Air (Passenger) Service Price Index
|
-
|
-
|
101.1
|
- Index is not compiled as the price reference period is FY 2025-26.
***
Abhijith Narayanan
(रिलीज़ आईडी: 2272872)
आगंतुक पटल : 2869