Ministry of Steel
India's Steel Sector Records Steady Growth in May 2026
Posted On:
25 JUN 2026 6:40PM by PIB Delhi
1. Steel Production & Prices
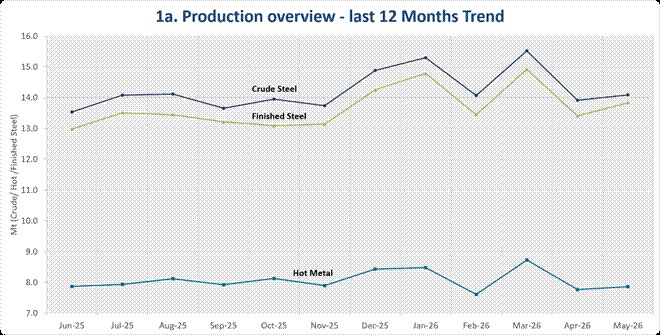
1a. Production Overview (in Mt)
|
Production
|
May 2026
|
May 2025
|
YoY %
|
Apr-May 2026
|
Apr-May 2025
|
CPLY %
|
|
Crude Steel
|
14.1
|
13.8
|
1.9
|
28.0
|
27.3
|
2.6
|
|
Hot Metal
|
7.9
|
7.8
|
1.1
|
15.6
|
15.3
|
2.2
|
|
Finished Steel
|
13.8
|
12.9
|
6.8
|
27.2
|
25.7
|
5.9
|
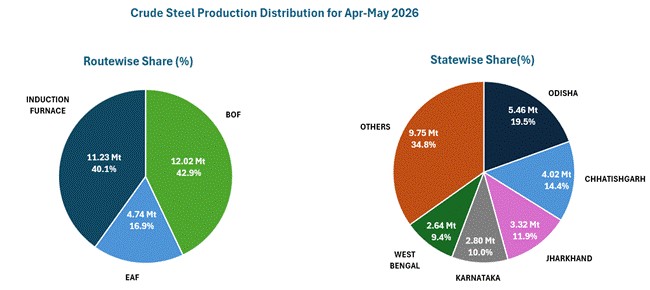
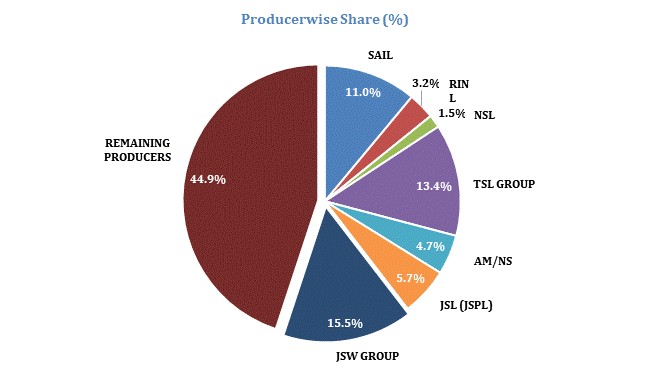
1b. Producer wise Production (Apr-May 2026)
|
Producer
|
Annual Crude Steel Capacity (Mt)
|
Crude Steel Production (Mt)
|
Finished Steel Production (Mt)
|
Hot Metal
Production
(Mt)
|
|
Top 7
|
117.4
|
15.4
|
14.4
|
14.5
|
|
Remaining producers
|
104.5
|
12.6
|
12.8
|
1.1
|
|
TOTAL
|
221.9
|
28.0
|
27.2
|
15.6
|
|
Public Sector Share (%)
|
13.9
|
15.7
|
13.2
|
30.4
|
|
Top 7 includes SAIL, RINL, NSL, TSL Group, AM/NS, JSL(JSPL), JSW Group
|
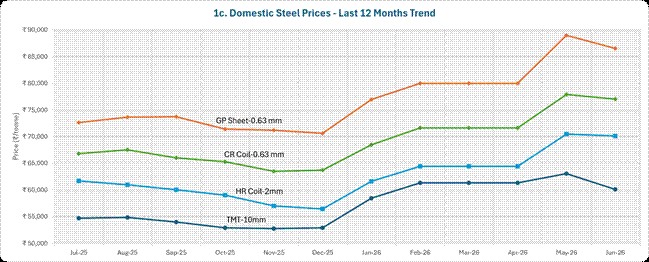
1c. Steel Prices (in ₹/tonne)
|
Product
|
Apr-26
|
May-26
|
Jun-26
|
MoM %
|
YoY %
|
|
TMT (10 mm)
|
61,330
|
63,053
|
60,068
|
-4.7%
|
4.4%
|
|
HR Coil (2 mm)
|
64,393
|
70,460
|
70,108
|
-0.5%
|
11.2%
|
|
CR Coil (0.63 mm)
|
71,598
|
77,915
|
77,053
|
-1.1%
|
11.4%
|
|
GP Sheet (0.63 mm)
|
79,993
|
89,013
|
86,505
|
-2.8%
|
15.8%
|
Note: Prices are inclusive of GST and shown in ₹/tonne, based on average prices from four metro cities—Kolkata, Delhi, Mumbai, and Chennai.
1d. Alloy Steel — Production, Import, Export & Consumption (in ‘000t)
|
Indicator
|
May 2026
|
May 2025
|
YoY %
|
Apr-May 2026
|
Apr-May 2025
|
CPLY %
|
|
Production
|
952.6
|
743.0
|
28.2
|
1811.0
|
1423.9
|
27.2
|
|
Import
|
120.2
|
96.3
|
24.9
|
228.0
|
205.3
|
11.1
|
|
Export
|
24.2
|
15.8
|
53.5
|
42.0
|
23.6
|
78.0
|
|
Consumption
|
1085.9
|
833.5
|
30.3
|
1993.7
|
1599.0
|
24.7
|
1e. Stainless Steel — Production, Import, Export & Consumption (in ‘000t)
|
Indicator
|
May 2026
|
May 2025
|
YoY %
|
Apr-May 2026
|
Apr-May 2025
|
CPLY %
|
|
Production
|
362.0
|
346.3
|
4.5
|
715.0
|
714.5
|
0.1
|
|
Import
|
105.4
|
35.9
|
193.5
|
201.0
|
100.5
|
100.0
|
|
Export
|
42.3
|
60.4
|
-30.0
|
84.0
|
102.2
|
-17.8
|
|
Consumption
|
482.5
|
309.9
|
55.7
|
872.8
|
696.0
|
25.4
|
|
Indicator
|
May 2026
|
May 2025
|
YoY %
|
Apr-May 2026
|
Apr-May 2025
|
CPLY %
|
|
Finished Steel Consumption
|
14.4
|
13.1
|
9.3
|
27.4
|
25.2
|
8.8
|
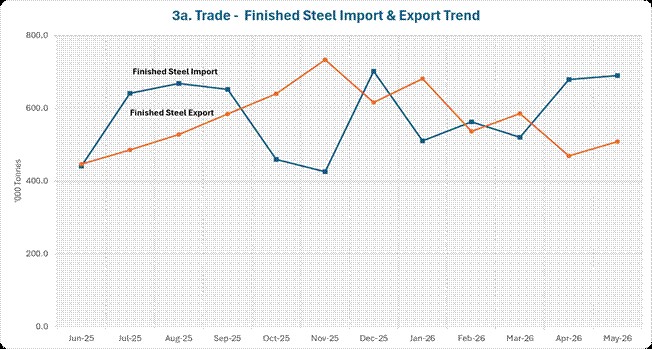
3a. Finished Steel — Import & Export
|
Indicator
|
Unit
|
May-26
|
May-25
|
YoY %
|
Apr-May 2026
|
Apr-May 2025
|
CPLY %
|
|
Imports
|
‘000 t
|
689.4
|
424.2
|
62.5
|
1368.2
|
943.3
|
45.0
|
|
Rs Crore
|
6878.2
|
4200.6
|
63.7
|
13301.2
|
9501.5
|
40.0
|
|
Exports
|
‘000 t
|
507.8
|
390.9
|
29.9
|
976.8
|
766.3
|
27.4
|
|
Rs Crore
|
3981.4
|
3434.6
|
15.9
|
7801.2
|
6519.1
|
19.7
|
|
Net Trade Position
|
India was net importer of finished steel in terms of quantity for the period of Apr-May 2026
|
3b. Top 5 Countries — Import & Export (Apr-May 2026)
|
Rank
|
Import Country
|
Vol. ('000t)
|
Share %
|
|
Rank
|
Export Country
|
Vol. ('000t)
|
Share %
|
|
1
|
China
|
428.1
|
31.3
|
|
1
|
UAE
|
157.5
|
16.1
|
|
2
|
Korea
|
361.1
|
26.4
|
|
2
|
Vietnam
|
115
|
11.8
|
|
3
|
Japan
|
259.8
|
19
|
|
3
|
Belgium
|
80.5
|
8.2
|
|
4
|
Vietnam
|
86.8
|
6.3
|
|
4
|
Nepal
|
79.3
|
8.1
|
|
5
|
Russia
|
61.1
|
4.5
|
|
5
|
Italy
|
65.7
|
6.7
|
3c. Top Categories — Import & Export (Apr-May 2026)
|
Rank
|
Import Category
|
Vol. ('000t)
|
Share %
|
|
Rank
|
Export Category
|
Vol. ('000t)
|
Share %
|
|
1
|
HR Coil/Strip
|
558.0
|
40.8
|
|
1
|
HR Coil/Strip
|
348.3
|
35.7
|
|
2
|
CR Coil/Sheets
|
223.5
|
16.3
|
|
2
|
Pipes
|
172.8
|
17.7
|
|
3
|
GP/GC Sheets/Coil
|
193.0
|
14.1
|
|
3
|
GP/GC Sheets/Coil
|
122.3
|
12.5
|
|
4
|
Plates
|
136.7
|
10.0
|
|
4
|
Bars & Rods
|
115.2
|
11.8
|
|
5
|
Elect. Sheets
|
86.1
|
6.3
|
|
5
|
Plates
|
114.8
|
11.8
|
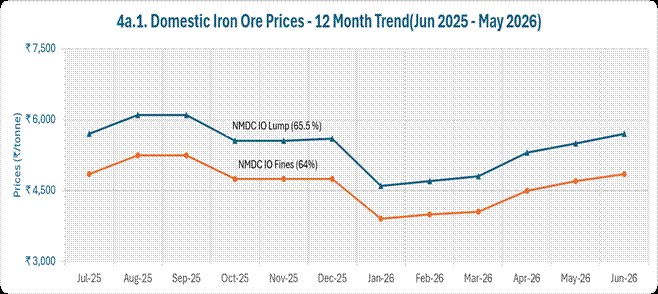
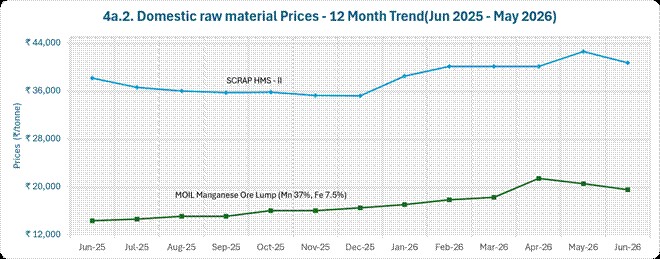
4a. Domestic Raw Material Prices
|
Commodity
|
Unit
|
May 2026
|
Jun 2026
|
MoM Change
|
|
NMDC Iron Ore Baila Lump (65.5%, 10-40 mm)
|
₹/tonne
|
5500
|
5700
|
3.8%
|
|
NMDC Iron Ore Baila Fines Baila Fines (64%, -10 mm)
|
₹/tonne
|
4700
|
4800
|
4.4%
|
|
MOIL Manganese Ore Lump (Mn 37%, Fe 7.5%)
|
₹/tonne
|
20532
|
19505
|
- 5.0%
|
|
Scrap — HMS II
|
₹/tonne
|
42533
|
40665
|
- 4.4%
|
4b. Mining Grants & Leases
|
Mineral
|
Total Active Leases as on 31 Mar 2024
|
No of auctioned mines block from Apr-24 to Jun-26
|
|
Iron Ore
|
337
|
46
|
|
Coking Coal
|
77
|
0
|
|
Manganese Ore
|
215
|
19
|
Source: Ministry of Coal, Ministry of Mines
|
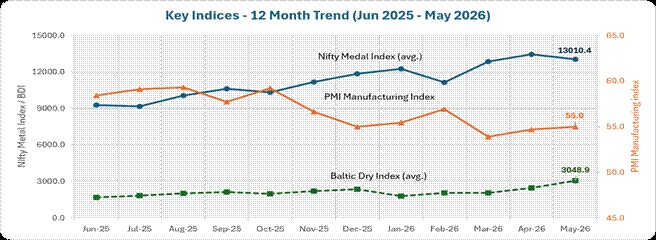
Index
|
Mar 2026
|
Apr 2026
|
May 2026
|
MoM Change
|
YoY Change
|
|
Nifty Metal Index (avg.)
|
12,833.1
|
13,441.0
|
13,010.4
|
-3.2 %
|
36.5%
|
|
PMI Manufacturing Index
|
53.9
|
54.7
|
55.0
|
0.5 %
|
- 4.5%
|
|
Baltic Dry Index (avg.)
|
2,047.5
|
2,442.8
|
3,048.9
|
24.8 %
|
115.0%
|
Source: NSE, S&P Global, Trading Economics
6. Policy Initiatives/Industry Initiatives
During May 2026, SAIL announced its FY2025-26 financial results, reporting record sales volume of 19.93 million tonnes and revenue of ₹110,810 crore. Sales volume increased by 11.4% year-on-year, reflecting strong market demand and improved operational performance.
India's total crude steelmaking capacity reached approximately 221.9 Mtpa as of May 2026, keeping the industry on track to achieve the National Steel Policy target of 300 Mtpa by 2030.
7. International Co-operation
SAIL and NMDC are actively exploring coking coal asset acquisitions, nickel supplies in Russia following a May 2026 delegation visit. SAIL has formed an internal committee to assess potential opportunities, while NMDC is evaluating overseas coal assets to strengthen long-term raw material security.
8. Green Steel Initiatives
SAIL's Bhilai Steel Plant received Environmental Product Declaration (EPD) certification for its TMT Bars, reinforcing its commitment to sustainable steelmaking. The plant's 15 MW floating solar project generates approximately 34.25 million units of clean power annually, supporting lower carbon emissions and energy sustainability. The certification enhances the product's environmental credibility and aligns with growing demand for green steel in domestic and global markets. These initiatives reflect SAIL's broader strategy to integrate renewable energy and environmentally responsible practices into its steel production operations
Source: Provisional JPC data for May 2026. Mt = Million Tonnes; Mtpa = Million Tonnes Per Annum; MoM = Month-on-Month; YoY = Year-on-Year; CPLY = Corresponding Period Last Year
****
AG
(Release ID: 2277931)
Visitor Counter : 629