Ministry of Statistics & Programme Implementation
Quarterly release of Performance Monitoring Dashboard of Infrastructure Sector in India
Strengthening evidence-based monitoring of infrastructure sub-sectors through timely dissemination of updated performance indicators
Posted On:
16 JUL 2026 4:00PM by PIB Delhi
The Ministry of Statistics and Programme Implementation (MoSPI) is releasing the quarterly update of the PAIMANA (Project Assessment, Infrastructure Monitoring & Analytics for Nation-building) Performance Dashboard, presenting the performance of key infrastructure sectors through a set of standardized indicators. The dashboard was launched on 16th April 2026 to strengthen infrastructure monitoring and evidence-based policymaking to provide a comprehensive view of the performance of key infrastructure sub-sectors. The latest quarterly update incorporates the most recent data across selected performance indicators, enabling timely monitoring, informed decision-making, and greater public access to official statistics.
Key Highlights of the quarterly update of the Performance Monitoring Dashboard:
- The quarterly update incorporates the latest data received from the respective Ministries/Departments, ensuring the timely dissemination of official infrastructure performance statistics.
- The Performance Monitoring Dashboard has now been expanded to 165 indicators. This expansion includes the addition of 54 new indicators, significantly enhancing the comprehensiveness of infrastructure performance monitoring.
- Quarterly update enhances transparency by making the latest infrastructure performance statistics available through a single, publicly accessible platform.
- Sector-wise narratives highlighting key trends and performance across selected indicators have been incorporated to facilitate better interpretation and understanding of the data.
|
- The PAIMANA-Performance Monitoring Dashboard provides a unified digital interface for monitoring sector-wise performance with interactive visualization and time-series analysis for improved accessibility for policymakers, researchers and stakeholders.
- The dashboard continues to monitor infrastructure performance using a standardized framework based on five dimensions - Access, Quality, Fiscal Cost & Revenue, Utilization, and Affordability.
- Distribution of Performance Indicators Across Infrastructure Sub-sectors:
|
S. No
|
Infrastructure sub-sector
|
Total number of indicators as on 16th July, 2026
|
|
1
|
Civil Aviation
|
31
|
|
2
|
Roads
|
8
|
|
3
|
Power
|
14
|
|
4
|
Ports, Shipping & Waterways
|
62
|
|
5
|
Telecommunications
|
13
|
|
6
|
Railways
|
37
|
|
Total
|
165
|
Sector-wise highlights from the quarterly update:
- Civil Aviation: Cargo carried in April 2026 is 98,920.1 tonnes registering 11.8% growth over April 2025. The number of aerodromes has increased to 165 with an increase of 91 since 2014.
- The Telecommunication sector sustained strong digital growth, with wireless/mobile data consumption reaching 2,85,376 petabytes (PB) during FY 2025–26 (24.7% YoY). The number of telephone subscribers also increased from 120.17 crore in FY 2024–25 to 133.06 crore in FY 2025–26, recording a 10.7% growth.
- Road Transport and Highways sector maintained steady progress, with 9,360 km of National Highways constructed during FY 2025–26, contributing to enhanced road connectivity across the country.
- Ports, Shipping & Waterways sector recorded steady growth with 2.06 crore passenger traffic at non-major ports during FY 2024–25. Coastal cargo handling increased to 196,808.7 thousand tonnes (3.09% YoY) at major ports and 142,219.4 thousand tonnes at non-major ports.
- Railways sector improved freight and passenger performance, with the average carrying capacity of Broad Gauge wagons increasing to a record 64.0 tonnes per wagon in 2024–25, compared to 60.8 tonnes in 2015–16 and average number of passengers carried per day reached 19.98 million, in 2024-25 (5.8% YoY).
- Power sector is poised for significant expansion in energy storage, with storage requirements projected to increase more than tenfold, from 87 GWh in 2027–28 to 888 GWh by 2035–36, driven by the rapid deployment of Battery Energy Storage Systems (BESS) and Pumped Storage Plants (PSPs).
|
- Civil Aviation: In FY 2026-27 (up to May), passenger traffic reached 7.1 crore and cargo handled stood at 7.3 lakh tonnes (10.7% YoY), reflecting sustained demand. The sector also facilitated 10.52 lakh foreign tourist arrivals during April–May FY 2026–27, reinforcing its role in boosting trade, tourism and global connectivity.
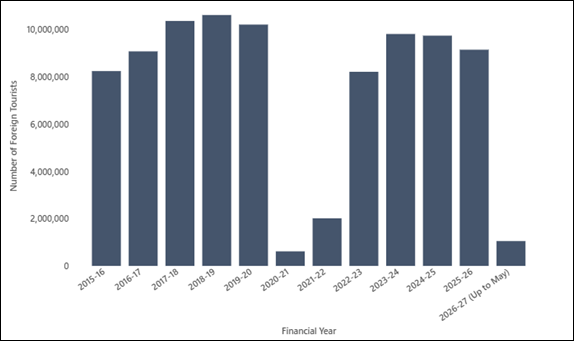
Number of foreign nationals arriving in India from FY 2015-16 onwards
- Power: Energy storage capacity is projected to increase significantly across both major technologies, with Pumped Storage Plant (PSP) and Battery Energy Storage System (BESS) capacities reaching 94 GW and 80 GW, respectively, by 2035–36. The sustained growth reflects India's strategic focus on strengthening grid reliability and enabling higher renewable energy integration.
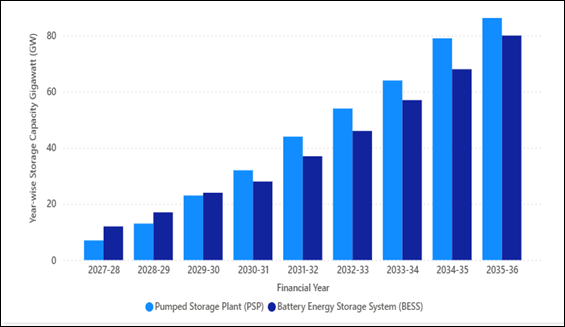
Energy storage capacity estimates till FY 2035-36
- Telecommunications sector witnessed robust growth, with telecom infrastructure expanding to 8.55 lakh towers (3.7% YoY) and 32.25 lakh Base Transceiver Stations (BTS) (7.4% YoY), while tele-density improved to 93.26% in FY 2025–26, reflecting deeper digital connectivity.
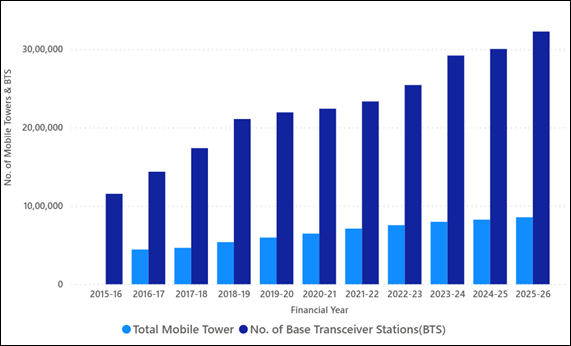
Number of Mobile Towers & Base Transceiver Stations from FY 2015-16 onwards
- Road Transport and Highways sector: Digital tolling also strengthened, with electronic toll collection transactions rising to 88.1 crores (40.3% YoY) in FY 2026-27 (up to May), indicating wider adoption of cashless toll systems.
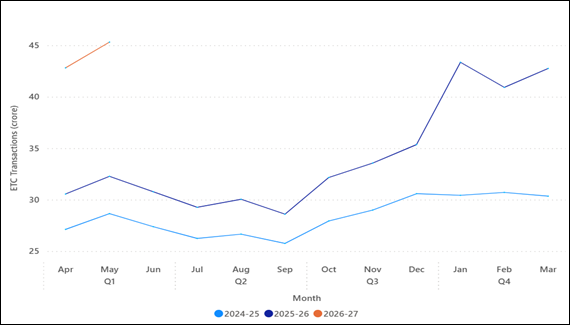
Quarterly electronic toll collection transactions
- Railways Sector has enhanced both freight efficiency and network capacity, with average freight load per wagon increasing to about 68 tonnes and the rail network expanding to over 1.37 lakh track kilometers in 2024–25.
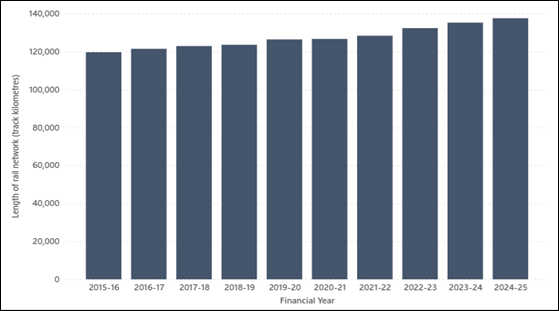
Total length of railway tracks available for train operations from FY 2015-16 onwards
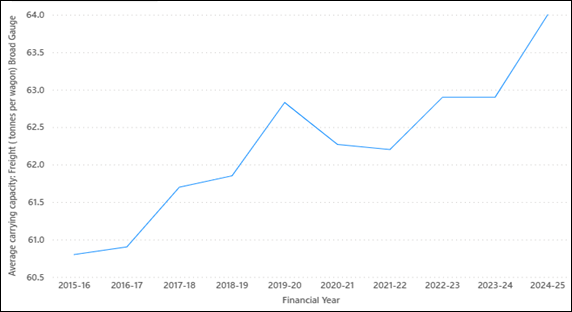
Average quantity of freight (tonnes) carried by each Broad-Gauge wagon from FY 2015-16 onwards
- Ports, Shipping and Waterways sector recorded strong growth, with India's fleet expanding to 1,592 vessels in 2025 (3% YoY), sea-borne trade for India nearly doubling from 76 million tonnes in 2015 to 145 million tonnes in 2023, and the inland water vessel fleet stands at 10,623 in 2024-25. The sector's growth was further supported by the expansion of total length of waterways to 29,151.9 km in FY 2024–25, strengthening multimodal logistics and enhancing maritime and inland water connectivity across the country.
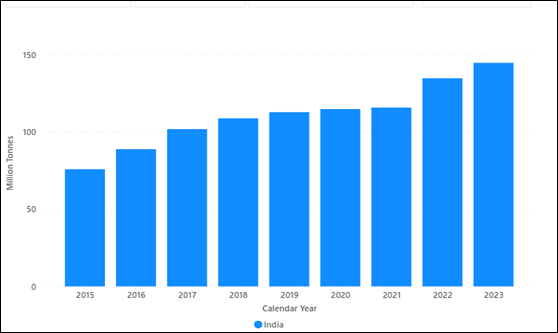
Sea-borne trade for India from 2015 onwards
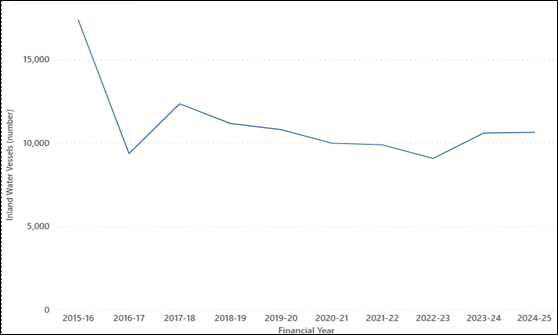
Inland water vessel fleet from FY 2015-16 onwards
With the release of the quarterly update, the PAIMANA Performance Monitoring Dashboard continues to represent a major step towards enhancing transparency, efficiency, and accountability in infrastructure monitoring. Regular quarterly updates to the dashboard will continue to enhance transparency, facilitate evidence-based policymaking, and support informed decision-making for sustainable and inclusive infrastructure development.
Next date of Press Release: Dashboards for Performance Monitoring will be updated on a quarterly basis. Next update would be on 16th Oct 2026.
Note: The press release summarizes highlights from the newly launched MoSPI’s performance monitoring dashboard, available at https://paimana-perf.mospi.gov.in or via the QR code

***
Samrat
(Release ID: 2285365)
Visitor Counter : 2119