PIB Backgrounder
PAIMANA: Strengthening Data-Driven Infrastructure Governance
Posted On:
10 AUG 2026 11:47AM by PIB Delhi
PAIMANA – An Overview
Efficient monitoring of infrastructure projects is essential for timely implementation, transparency and governance. To support this, PAIMANA (Project Assessment, Infrastructure Monitoring and Analytics for Nation-Building) was launched on 25 September 2025 as a web-based platform for monitoring Central Sector infrastructure projects in India. The platform replaces the earlier OCMS-2006 (Online Computerized Monitoring System). Developed by the Ministry of Statistics and Programme Implementation (MoSPI), PAIMANA is used for monitoring ongoing Central Sector infrastructure projects costing ₹150 crore or more.
MoSPI has launched a module called PAIMANA-CRIP on 08th July 2026, replacing DPIIT’s Integrated Project Monitoring Portal (IPMP), envisioned to evolve as Central Repository of Infrastructure Projects. The project-related data for PRAGATI (Pro-Active Governance and Timely Implementation), PMG and other review mechanisms would subsequently be sourced and updated through the same.
Over 20+ Ministries/Departments/ Implementing Agencies regularly update the information of projects on PAIMANA-CRIP through data entry or via API (Application Programming Interfaces) modes.
Currently, the Project Monitoring vertical of the PAIMANA portal is integrated with DPIIT’s IPMP/ IIG through API-based data exchange. Over 60 per cent of projects on PAIMANA are being updated automatically through APIs from the MIS or web platforms of respective Ministries/ Departments.
In addition to strengthening project monitoring, PAIMANA has expanded its role to support infrastructure performance monitoring through a dedicated Performance Monitoring Dashboard. Launched on 16th April, 2026, the dashboard tracks infrastructure performance across major sub-sectors through a comprehensive set of indicators. It marks a significant advancement towards data-driven governance and evidence-based policymaking.
Performance Monitoring Dashboard at a Glance
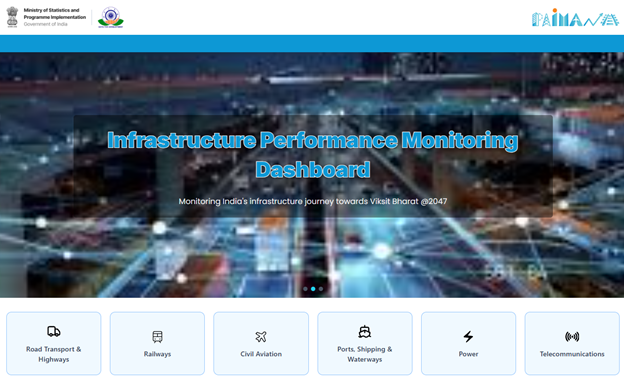
The Performance Monitoring Dashboard brings together performance indicators across key infrastructure sectors in a unified digital platform. The indicators are compiled from official data provided/published by the concerned Ministries and Departments and are updated periodically based on the latest available information. The dashboard presents these data through interactive visualizations and analytical tools, enabling users to monitor trends and assess sectoral performance over time.
Key Features of the Performance Monitoring Dashboard
- The Performance Monitoring Dashboard is built on a comprehensive indicator framework developed in consultation with the National Institute of Public Finance and Policy (NIPFP). The framework aligns with the Harmonized Master List (HML) of Infrastructure (2022), issued by the Department of Economic Affairs (DEA), which serves as the national classification framework for infrastructure sectors eligible for policy support, investment planning and financing-related benefits.
- Indicators have been streamlined to prevent overlap with established indices. Examples include the Index of Industrial Production (IIP) and the Eight Core Industries.
- A detailed indicator framework spans six infrastructure sub-sectors. These are Power, Civil Aviation, Telecommunications, Railways, Roads, and Ports, Shipping & Waterways.
- The Performance Monitoring Dashboard has now been expanded to 165 indicators. This expansion includes the addition of 54 new indicators, significantly enhancing the comprehensiveness of infrastructure performance monitoring.
- A single digital interface allows monitoring of performance sector by sector. It offers interactive visualisation and time-series analysis for policymakers, researchers and stakeholders.
- A centralised dashboard delivers one cross-sector view of infrastructure sectors. This capability deepens inter-sectoral analysis.
- The current framework gauges sectoral performance through growth rates. It reviews year-on-year, month-on-month and cumulative growth, targets and capacity utilisation in chosen sectors.
Distribution of Performance Indicators Across Sub-sectors (as on 16th July, 2026)
|
S. No
|
Infrastructure Sub-sector
|
Total Number of Indicators
|
|
1
|
Civil Aviation
|
31
|
|
2
|
Roads
|
8
|
|
3
|
Power
|
14
|
|
4
|
Ports, Shipping & Waterways
|
62
|
|
5
|
Telecommunications
|
13
|
|
6
|
Railways
|
37
|
|
Total
|
165
|
The Revamped Monitoring Approach
The revamped approach marks a shift from measuring sectoral outputs (production) to assessing multi-dimensional infrastructure performance across the dimensions of access: which measure how widely infrastructure is available; quality: which assess its usefulness and reliability; fiscal cost & revenue: which assess allocation and use of financial resources for infrastructure; utilization: evaluate how efficiently infrastructure is used for its defined purpose; affordability: determine whether it is economically accessible to people. The above categorisation of indicators improves analysis by moving beyond simple output tracking to a more holistic evaluation of infrastructure performance across multiple dimensions, enabling informed policy decisions and targeted interventions.
Engaging Stakeholders
Stakeholders, including concerned Ministries and Departments, receive regular updates on their project execution. These updates draw on the data analytics generated within PAIMANA. Such analytics help them act wherever project execution needs attention.
- Ongoing coordination takes place through monthly review meetings and other exchanges. This practice reinforces evidence-based monitoring by providing timely updates on performance indicators.
- Login credentials for tailored dashboards are available with every Line Ministry and Department. Consequently, they can directly access the portal to review project progress.
Infrastructure Projects Monitored (Data as of June 2026)
- As of June 2026, 1,847 ongoing projects were under watch across 17 Central Ministries and Departments. Together they carry a revised cost of ₹ 40.54 lakh crore.
- Spending on these projects has so far reached ₹ 21.97 lakh crore. This equals about 54.18 per cent of the revised cost, reflecting steady advancement.
- Many projects have reached advanced stages of completion. Around 709 projects (~39%) exceed 80% physical progress. About 337 projects (~19%) have passed 80% financial completion.
- The Transport & Logistics sector leads in the number of ongoing projects. It holds 1,341 projects worth ₹22.32 lakh crore, reflecting the focus on connectivity.
- The ongoing infrastructure projects include 769 mega projects, each costing ₹1,000 crore or more, worth ₹30.51 lakh crore.
- They also include 1,078 major projects, each costing ₹150–1,000 crore, worth ₹5.10 lakh crore.
Ministry / Department-wise Progress of Infrastructure Projects
- The Ministry of Road Transport & Highways records the largest project count. It manages 1,022 projects (55%) with a revised cost share of Rs. 9.89 lakh crore (24%).
- The Ministry of Railways is carrying out 255 projects (14%). These carry a combined revised cost of Rs. 8.69 lakh crore (21%).
- The Ministry of Coal is running 121 projects (7%). Their combined revised cost stands at Rs. 2.22 lakh crore (6%).
- Four other ministries/departments are also implementing a significant number of projects.
o The Ministry of Petroleum & Natural Gas is managing 105 projects with a revised cost of ₹4.33 lakh crore.
o The Ministry of Power is handling 98 projects with a revised cost of ₹5.71 lakh crore.
o The Ministry of Housing & Urban Affairs is implementing 50 projects with a revised cost of ₹3.65 lakh crore.
o The Department of Water Resources, River Development & Ganga Rejuvenation is managing 40 projects with a revised cost of ₹2.04 lakh crore.
- The other 156 projects (8%) carry a combined revised cost of Rs. 4.02 lakh crore (10%). They span across several Ministries and Departments, such as Higher Education, Civil Aviation, Steel, Telecommunications, Labour & Employment, Ports, Shipping & Waterways, Health & Family Welfare, Mines, DPIIT, and Sports.
Towards Data-Driven Governance
The PAIMANA portal encapsulating modules of the Central repository of infrastructure projects along with outcomes as Reports/ dashboard on overview of Central sector projects costing ₹150 crores & above and the Performance monitoring dashboard would play significant stride towards transparency, efficiency and accountability. Their regular updates keep strengthening infrastructure oversight. They aid evidence-based policymaking and enable well-informed decisions. Overall, the effort promotes sustainable and inclusive infrastructure growth nationwide.
References:
Ministry of Statistics and Programme Implementation (MoSPI):
https://paimana-proj.mospi.gov.in/ReportPage
https://www.pib.gov.in/PressReleasePage.aspx?PRID=2286550®=%203&lang=1
https://www.pib.gov.in/PressReleasePage.aspx?PRID=2285365®=48&lang=1
https://www.pib.gov.in/PressReleasePage.aspx?PRID=2226267®=3&lang=1
https://www.pib.gov.in/PressReleasePage.aspx?PRID=2252587®=3&lang=1
https://www.pib.gov.in/PressReleasePage.aspx?PRID=2244898®=3&lang=1
https://www.pib.gov.in/PressReleasePage.aspx?PRID=2277758®=48&lang=2
https://www.pib.gov.in/PressReleasePage.aspx?PRID=2290413®=48&lang=1
Click to see in pdf
***
PIB Research
(Release ID: 2296968)
Visitor Counter : 4040