PIB Backgrounder
India's Higher Education Sector
A Decade of Growth, Access, and Inclusion
Posted On:
30 AUG 2026 10:15AM by PIB Delhi
Building India’s Knowledge Ecosystem: A Decade of Progress
Higher education is a cornerstone of India’s journey towards a knowledge-based economy and a key pillar of the National Education Policy (NEP) 2020. The policy envisions an education system that promotes holistic, multidisciplinary learning and advances the goals of SDG 4. Sustainable Development Goal (SDG) 4 focuses on ensuring inclusive and equitable quality education and promoting lifelong learning opportunities for all. The Ministry of Education conducts an annual survey of Higher Education Institutions in India.
The All India Survey on Higher Education (AISHE), conducted annually by the Ministry of Education, provides a comprehensive evidence base on Higher Education Institutions (HEIs) across the country. The data helps track the progress of higher education reforms under NEP 2020, identify emerging gaps, and inform policy responses.
A Growing Higher Education Footprint
According to AISHE reports, India’s higher education network has expanded significantly over the decade.
- The number of universities increased from 760 in 2014–15 to 1,289 in 2023–24, representing a growth of 69.6%.
- The number of colleges rose from 38,498 to 48,246, an increase of 25.3%.
- Standalone institutions increased from 12,276 to 15,221, registering about 24% growth.
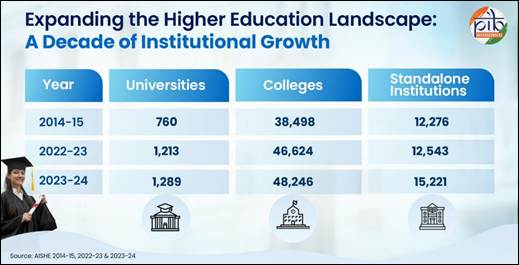
This expansion reflects a widening institutional base and greater capacity to serve learners across the country. It has strengthened the reach of higher education, supported broader participation, and contributed to building a more accessible, diverse, and inclusive knowledge ecosystem for India’s future.
Increasing Student Enrolment: Advancing Equity and Inclusion
Higher education enrolment in India has risen steadily over the past decade, growing 31.5% from 3.42 crore students in 2014–15 to 4.50 crore in 2023–24.
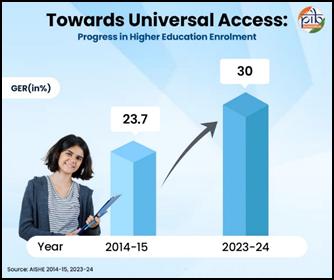
- The Gross Enrolment Ratio (GER) in higher education rose from 23.7% in 2014–15 to 29.5% in 2022–23, and further to 30% in 2023–24. This steady increase reflects growing access to and participation in higher education, supporting NEP 2020's target of raising the GER to 50% by 2035.
- From 2014-15 to 2023-24, level-wise percentage increase in total enrolments was:
- Ph.D 1.17 lakh to 3.43 lakh (192.89%); Post Graduate 38.53 lakh to 57.85 lakh (50.15%); Under Graduate 2.71 crore to 3.45 crore (27.27%);
- Diploma 25.08 lakh to 33.15 lakh (32.22%); Certificate 1.70 lakh to 2.08 lakh (22.55%); Integrated 1.41 lakh to 5.69 lakh (301.36%).
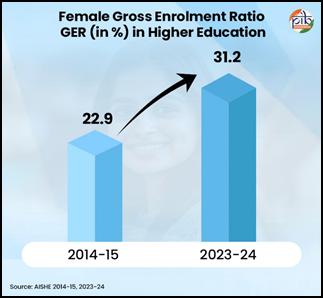
- Female enrolment in higher education has witnessed steady growth over the past decade. It grew by 42.2%, rising from 1.57 crore in 2014–15 to 2.24 crore in 2023–24, outpacing the growth in total enrolment during the decade. The number of female students enrolled in various courses in 2023-24 was:
- Ph.D: 1.71 lakh; Post-Graduate: 32.53 lakh; Under Graduate: 1.71 crore
- PG Diploma: 91,332; Diploma: 13.27 lakh; Certificate: 1.10 lakh, and Integrated: 2.73 lakh.
- Female GER increased from 22.9% in 2014–15 to 31.2% in 2023–24, surpassing male GER (28.9%) for the seventh consecutive year.
- Higher education out-turn increased from 88.28 lakh in 2014–15 to over 1.09 crore in 2023–24 a 24.06% increase. The growth reflects improved programme completion, enhanced retention, rising enrolment, and expanded institutional capacity. Supported by government initiatives, this trend highlights progress in access, equity, quality, and performance in higher education.
Higher education out-turn refers to the total number of students who pass out of higher education institutions in a given academic year.
- Gender Parity Index (GPI) in higher education improved significantly, rising from 0.92 in 2014–15 to 1.08 in 2023–24. GPI for the SC category increased from 0.91 to 1.11, while ST category GPI rose from 0.81 to 1.08 during the same period.
- The rising GPI points to increasing parity favoring females. The progress highlights the impact of government initiatives in promoting equity, inclusion, and balanced participation in higher education.
|
Gender Parity Index (GPI)
The Gender Parity Index (GPI) is the ratio of GER for females to GER for males, reflecting equitable participation of females in the education system.
- A GPI of 1 indicates parity between the sexes.
- A GPI between 0 and 1 typically indicates a disparity favoring males.
- A GPI greater than 1 indicates a disparity favoring females.
|
- The share of SC enrolment rose from 13.44% in 2014–15 to 15.5% in 2023–24 in total enrolment. During the same period, the share of ST enrolment increased from 4.8% to 6.4%. OBC participation climbed from 32.8% to 40.1%, registering the largest increase in enrolment share among all social categories.
- The GER for SC students increased from 18.9% in 2014–15 to 27.8% in 2023–24. For the ST students, it increased from 13.5% in 2014–15 to 22.8% in 2023–24. Increasing participation of students from SC, ST and OBC categories reflects growing inclusivity in higher education.
- Persons with Benchmark Disability (PwBD) enrolment increased from 64,298 in 2014–15 to 88,816 in 2022–23, registering a growth of 38.1%. Male and female enrolment grew by 54.4% and 19.0%, respectively, during this period.
- In 2023–24, 54,080 PwBD students were enrolled, including 34,080 males and 20,000 females. Higher male enrolment among PwBD points to a persistent gender imbalance in access to higher education. This suggests that improvements in access have not translated equally across genders.
Science, Technology, Engineering, and Mathematics (STEM) Enrolment
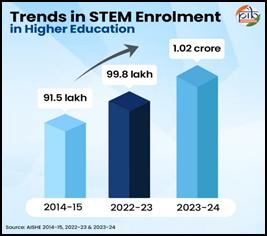
Science, Technology, Engineering, and Mathematics (STEM) enrolments in higher education have increased steadily over the past decade.
Total enrolments increased from 91.5 lakh in 2014–15 to 1.02 crore in 2023–24, representing an overall increase of approximately 11.5% over the period.
The growth reflects expanding institutional capacity and sustained student interest in STEM disciplines, driven by government initiatives, digital technologies, innovation, research, and employment opportunities strengthening India's knowledge economy.
Foreign Student Enrolment in Higher Education
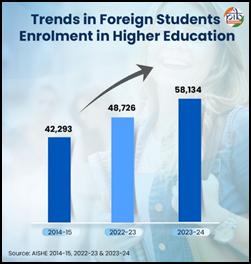
- Foreign student enrolment rose from 42,293 in 2014–15 to 58,134 in 2023–24, an increase of approximately 37.5% over the past decade — reflecting India's growing appeal as a destination for higher learning among international students.
- This points to the growing internationalisation of higher education, enhanced academic collaborations and global recognition of Indian institutions.
Faculty Growth in Higher Education
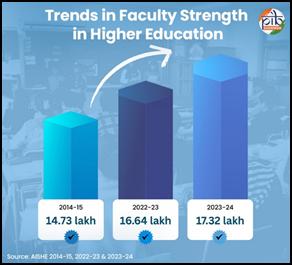
The number of teachers in higher education increased from 14.73 lakh in 2014–15 to 17.32 lakh in 2023–24, representing an overall increase of 2.59 lakh teachers, or approximately 17.6% growth during the period.
- The absolute number of female teachers grew by 36.7% between 2014–15 and 2023–24, reflecting growing equity in employment opportunities for women in the sector.
- In both 2022–23 and 2023–24, the share of male teachers in the total teaching workforce remained higher than that of female teachers.
- In 2022-23, the share of female teachers was 44.3%. It grew marginally to 44.9% in 2023-24.
Infrastructure facilities
Between 2014–15 and 2023–24, infrastructure facilities in higher education institutions have improved considerably. Physical and digital infrastructure, green infrastructure and separate amenities for women and PwBD have been developed across institutions. In 2023–24:
- 94% of universities, 95% of colleges, and 91% of standalone institutions had a playground.
- 98% of universities, 98% of colleges, and 98% of standalone institutions had a library facility.
- 89% of universities, 85% of colleges, and 94% of standalone institutions had a laboratory.
In addition, most universities, colleges, and standalone institutions were also equipped with facilities such as health centres, skill development and computer centres, auditoriums, and conference halls.
Towards a Future-Ready Higher Education Ecosystem
India’s higher education sector has expanded significantly over the past decade, with growth in institutions, enrolment, faculty strength and student out-turn. Improvements in Gross Enrolment Ratio, women’s participation, gender parity, and inclusion of SC, ST and other disadvantaged groups reflect enhanced access and equity. Rising enrolment in STEM and international students indicates the strengthening of India's knowledge ecosystem. Together, these achievements highlight the impact of NEP 2020 in promoting quality, inclusion, and excellence.
References
Ministry of Education
https://www.pib.gov.in/PressReleasePage.aspx?PRID=2282525®=48&lang=1
https://cdnbbsr.s3waas.gov.in/s392049debbe566ca5782a3045cf300a3c/uploads/2025/06/202506041473712372.pdf
https://cdnbbsr.s3waas.gov.in/s392049debbe566ca5782a3045cf300a3c/uploads/2026/07/20260708401535366.pdf
https://cdnbbsr.s3waas.gov.in/s392049debbe566ca5782a3045cf300a3c/uploads/2026/07/202607131602421770.pdf
Click to see pdf
***
PIB Research
(Release ID: 2304606)
Visitor Counter : 946