Ministry of Statistics & Programme Implementation
Quarterly release of Performance Monitoring Dashboard of Infrastructure Sector in India
India’s Infrastructure Sectors Witness Sustained Growth in Capacity, Connectivity and Cargo Movement
National Highway Projects Awarded Jump 62.9% to 2,236.3 Km during FY 2026-27 (April-September)
Optical Fibre Cable Network Expands to 7.5 Lakh Km, with 29,256 Km Added during FY 2026-27 (April-August)
Major Ports Register 7.2% Growth in Cargo Handling; Non-Major Ports Record 1.8% Growth during FY 2026-27 (April-August)
Air Cargo Traffic Surges 12% to 18.6 Lakh Tonnes during FY 2026-27 (April-August) with Delhi airport: handling maximum volume of 5.3 lakh tonnes
India’s Power Capacity Rises 12.1% to 5.33 Lakh MW; Renewable Energy Capacity Surges 29.5%, Accounting for 42% of Total Installed Capacity (FY 2025-26)
Posted On:
16 OCT 2026 4:00PM by PIB Delhi
The Ministry of Statistics and Programme Implementation (MoSPI) is releasing the quarterly update of the PAIMANA (Project Assessment, Infrastructure Monitoring & Analytics for Nation-building) Performance Dashboard, presenting the performance of key infrastructure sectors through a set of standardized indicators. The dashboard was launched on 16th April 2026 to strengthen infrastructure monitoring and evidence-based policymaking to provide a comprehensive view of the performance of key infrastructure sub-sectors.
Key highlights of the quarterly update of the Performance Monitoring Dashboard:
- The quarterly update incorporates the latest data received from the respective Ministries/Departments/corresponding official reports or publications, ensuring the timely dissemination of official infrastructure performance statistics.
- The Performance Monitoring Dashboard has now been expanded to 184 indicators. This expansion includes the addition of 21 new indicators, significantly enhancing the comprehensiveness of infrastructure performance monitoring.
- The quarterly data has also been updated for 41 indicators across the Power, Civil Aviation, Ports, Shipping & Waterways, and Road Transport & Highways sectors, further strengthening the timeliness and comprehensiveness of infrastructure performance monitoring.
- Quarterly updates provide public access to the latest infrastructure performance statistics through a single platform, with sector-wise narratives highlighting key trends across selected indicators.
|
- The PAIMANA-Performance Monitoring Dashboard provides a unified digital interface for monitoring sector-wise performance with interactive visualization and time-series analysis for improved accessibility for policymakers, researchers and stakeholders.
- The dashboard continues to monitor infrastructure performance using a standardized framework based on five dimensions - Access, Quality, Fiscal Cost & Revenue, Utilization, and Affordability.
Distribution of performance indicators across infrastructure sub-sectors on dashboard:
|
S. No
|
Infrastructure sub-sector
|
No. of Indicators
|
|
1
|
Civil Aviation
|
30
|
|
2
|
Road Transport & Highways
|
10
|
|
3
|
Power
|
14
|
|
4
|
Ports, Shipping & Waterways
|
62
|
|
5
|
Telecommunications
|
31
|
|
6
|
Railways
|
37
|
|
Total
|
184
|
Sector-wise highlights from the quarterly update:
- Civil Aviation sector recorded sustained growth in air cargo movement, with cargo handled increasing by 12.0% YoY during FY 2026-27 [April-August] with volumes reaching to 18.6 lakh tonnes, indicating broad based growth in air freight activity.
- Telecommunication sector recorded continued expansion of digital infrastructure, with cumulative Optical Fibre Cable (OFC) laid reaching 7,52,113 km by August 2026. This represents an addition of 29,256 km during FY 2026-27 [April-August], strengthening the country’s high speed digital connectivity infrastructure.
- Road Transport and Highways sector recorded 2,236.3 km of National Highway projects awarded in FY 2026–27 [April-September] registering a robust 62.9% YoY growth. This significant increase strengthens the pipeline of highway infrastructure development, paving the way for enhanced connectivity, improved logistics efficiency, and sustained economic growth.
- Ports, Shipping and Waterways sector recorded continued growth in cargo traffic, with cargo handled at Major Ports increasing by 7.2% YoY to 390.4 million tonnes during FY 2026-27 [April-August]. Cargo traffic at Non-Major Ports increased by 1.8% YoY to 313.4 million tonnes during the same period. Overall, the growth reflects sustained cargo movement and continued utilisation of port infrastructure supporting domestic and international trade.
- Indian Railways strengthened its capacity, with the number of coaches increasing by 4.5% and locomotives by 6.4% in FY 2024–25.
- Power sector sustained strong growth, with installed capacity rising to 5,32,739.7 MW (12.1% YoY) in FY 2025–26.
|
- Civil Aviation sector continues to support India’s growing international tourism footprint, with 30.49 lakh foreign tourist arrivals recorded up to August in FY 2026–27, registering 2% YoY growth. This positive momentum reinforces the sector’s role in strengthening international air connectivity, facilitating tourism growth, and enhancing India’s position as a global travel destination.
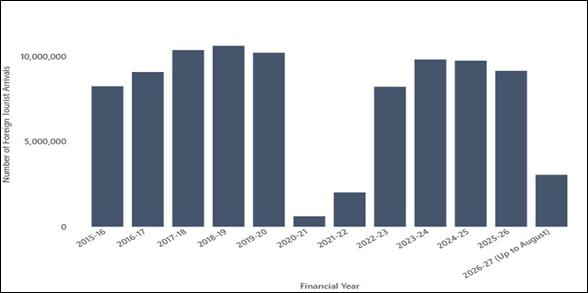
Number of foreign nationals arriving in India from FY 2015-16 onwards
- Power sector recorded a 12.1% YoY increase in total installed capacity, reaching 5,32,739.7 MW as of March 2026. Renewable Energy Sources (RES) capacity grew by 29.5% to 2,23,273 MW, significantly outpacing overall capacity growth and accounting for about 42% of total installed capacity. The trend highlights the increasing contribution of renewable sources to India’s power capacity mix and continued diversification of the electricity generation capacity base.
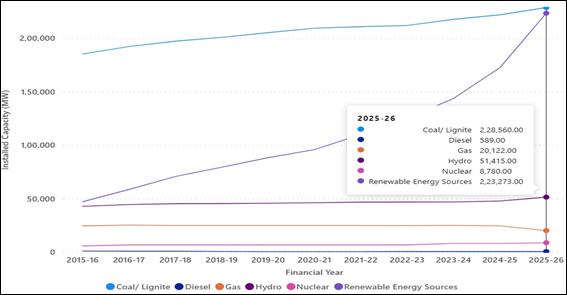
Installed Power Generation Capacity by Source
- Telecommunication sector continued strong digital expansion, with wired broadband subscribers growing by 12.4% YoY and wireless broadband subscribers by 12.9% YoY for FY 2025-26, reflecting sustained growth in broadband connectivity and digital adoption. The number of Gram Panchayats connected also increased to 2,23,814 as of August 2026, representing addition of 5,352 in FY 2026-27 [April-August] strengthening rural digital connectivity and expanding access to digital infrastructure across the country.
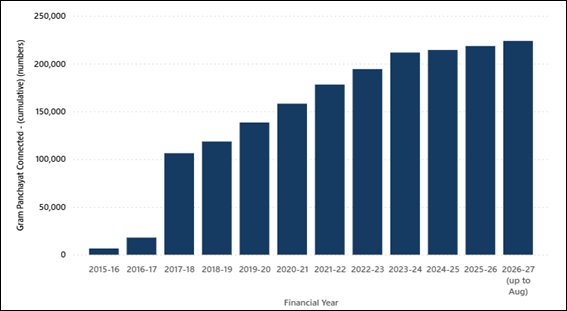
Number of Gram Panchayat Connected
- Railways has strengthened its infrastructure and freight capacity, with cumulative electrified track kilometers increasing by 4.8% and the number of railway wagons rising by 5.4% in FY 2024–25.
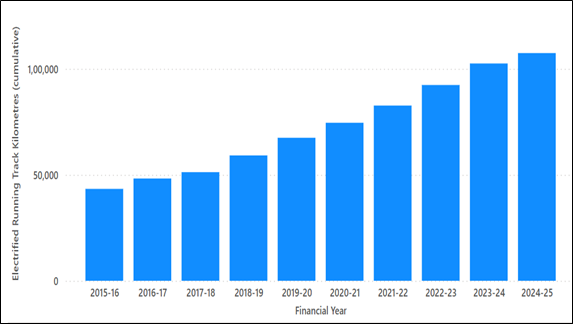
Length of electrified running track
- Road Transport and Highways sector continued to witness expansion in electronic toll collection, with ETC transactions increasing to 225.2 crores during FY 2026-27 [April-September] registering a YoY growth of 24.1%. Further, the electronic toll collection value stands at ₹36,994.5 crore for the same period with YoY growth of 11.7%, indicating sustained adoption of electronic tolling and increasing digitalization of toll collection across the road network.
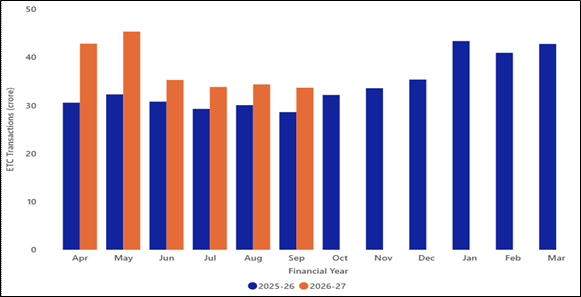
Electronic Toll Collection Transactions
- Ports, Shipping and Waterways Sector: Major Ports recorded continued growth in cargo handling, with cargo handled across key commodities increasing by 7.2% YoY to 390.4 million tonnes during FY 2026-27 [April - August]. Petroleum and Crude Products remained the largest commodity category, accounting for about 29.2% of total cargo handled, with a 3.1% YoY increase.
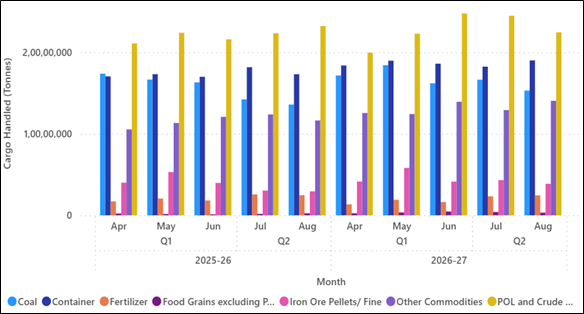
Commodity Wise Cargo Traffic Handled at Major Ports
With the release of the quarterly update, the PAIMANA Performance Monitoring Dashboard continues to represent a major step towards enhancing transparency, efficiency, and accountability in infrastructure monitoring. Regular quarterly updates to the dashboard will continue to enhance transparency, facilitate evidence-based policymaking, and support informed decision-making for sustainable and inclusive infrastructure development.
Next date of Press Release: Dashboards for Performance Monitoring will be updated on a quarterly basis. Next update would be on 15th January 2027.
Note: The press release summarizes highlights from the newly launched MoSPI’s performance monitoring dashboard, available at https://paimana-perf.mospi.gov.in or via the QR code
See Press Release in PDF

***
Samrat
(Release ID: 2324355)
Visitor Counter : 191
Read this release in:
Urdu