Posted On:
14 NOV 2026 8:52PM by PIB Delhi
India’s exports grew 16.66% to US$ 568.84 billion during April-October FY 2026-27, with gains across products, services and overseas markets. Export promotion measures, expanding trade partnerships and improved logistics are helping Indian businesses sustain this momentum. This growth complements India’s broader economic progress, marked by 7.8% GDP growth in April-June and unemployment declining to 5.1% in July-September. Major international organisations also reinforce this positive picture, projecting continued strong growth for FY 2026-27.
|
Introduction
International trade enables businesses to grow beyond domestic markets, supporting productivity and long-term economic development. For India, exports have been an important contributor to economic growth, helping sustain expansion despite global headwinds.
This progress has sustained over several years. After reaching a new high in FY 2021-22, India’s total exports set fresh records in each successive financial year. By FY 2025-26, they had reached US$ 863.1 billion, completing five consecutive years of record exports.
This momentum has continued into FY 2026-27, with higher export values and growth across a range of products and overseas markets.
India’s Export Growth Continues in FY 2026-27
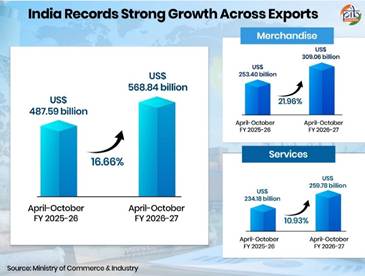
Total exports are estimated at US$ 568.84 billion during April-October FY 2026-27, up 16.66% from US$ 487.59 billion a year earlier. The increase reflected growth in both merchandise and services exports.
Merchandise exports recorded 21.96% growth during the period, whereas, services exports recorded 10.93% growth.
Exports Recorded Positive Growth Every Month of FY 2026-27
The strength of this performance is sustained across the first half of FY 2026-27. Total exports reached record US$ 479.0 billion during April-September FY 2026-27. Merchandise and services exports also achieved their highest-ever values for this period.
- Merchandise exports reached US$ 259.71 billion, registering 18.4% year-on-year growth.
- Services exports reached US$ 219.27 billion, registering 10.2% year-on-year growth.
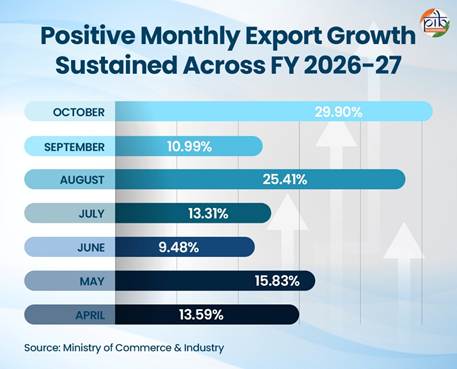
October added further momentum, with total exports estimated at US$ 89.99 billion, registering 29.90% year-on-year growth.
- Merchandise exports surged 45.06% to US$ 49.47 billion.
- Services exports were estimated at US$ 40.51 billion, registering ~15.2% Y-o-Y growth.
Broad-Based Sectoral Growth in India’s Exports
- Services Remain a Strong Pillar of India’s Exports: India’s services exports have expanded faster than the global average over the past decade. Services exports have helped cushion India’s external sector against geopolitical disruptions, reducing vulnerabilities and supporting trade stability.
Between 2015 and 2025, they grew at a compound annual rate of 10.3%, compared with 6.6% globally. Consequently, India’s share of global services exports increased from 3.1% to 4.3%. During April-October FY 2026-27, they accounted for ~45.7% of total exports.
India’s growing network of trade agreements is widening access to overseas markets for its services sector. These agreements ease professional mobility and open opportunities for Indian providers across diverse services.
- Strong Sectoral Gains Support India’s Export Momentum: India’s merchandise export growth drew strength from industrial goods as well as agricultural and traditional products. During April-October FY 2026-27, seven of the ten leading export categories recorded double-digit growth. Major growth categories include:
|
Selected Export Category
|
Year-on-year growth
|
|
Other cereals*
|
109.74%
|
|
Petroleum products
|
47.71%
|
|
Electronic goods
|
46.92%
|
|
Meat, dairy and poultry
|
40.81%
|
|
Handicrafts, excluding hand-made carpets
|
36.05%
|
|
Engineering goods
|
22.00%
|
|
Plastic and linoleum
|
19.57%
|
|
Organic and inorganic chemicals
|
18.21%
|
|
Marine products
|
13.32%
|
|
Gems and jewellery
|
12.16%
|
|
*Other cereals include rye, barley, oats, fonio, quinoa, etc, and excludes wheat, rice, maize, and millet
|
The wider export basket also reflects strong growth. Non-petroleum exports rose 18.01% to US$ 259.22 billion Y-o-Y in April-October FY 2026-27 .
|
Export Success Takes Shape Across Sectors
|
|
From electronic components to processed foods, individual product successes illustrate the range of goods reaching overseas markets.
A Wider Range of Electronics Drives Growth: Electronic goods exports grew 44% Y-o-Y to US$ 31.97 billion during April-September FY 2026-27, with gains across smartphones and other electronics.
- Non-smartphone exports expanded 56.5%, outpacing smartphone growth of 35.8%.
- Growth extended across components and equipment. Other mounted circuit boards surged 3,219%.
- Memory chips and solid-state storage devices grew 2,332% and 1,681%, respectively.
- Loaded circuit boards increased 304%, and networking equipment rose 98%.
- Singapore, China and Hong Kong featured prominently among leading destinations for these products. Malaysia was the leading destination for memory chips, while the US and the Netherlands were major markets for networking equipment.
|
|
Indian Staples Make Global Gains : Alongside electronics, certain agricultural products also recorded strong export growth during April-September FY 2026-27.
- Basmati rice exports rose 25% year-on-year to US$ 1,601 million, with Iran, Saudi Arabia and the USA among leading markets.
- Growth also extended to processed foods, with frozen potato exports increasing 21% to US$ 179 million.
- Yellow dent corn recorded the sharpest growth among these products, surging 1,156% to US$ 123 million. Its leading markets included Bangladesh, Vietnam and the Philippines.
|
India’s Export Footprint Grows Across Global Markets
India’s export growth also found strength across its leading overseas markets. During April-October FY 2026-27, eight of the ten largest merchandise export destinations recorded double-digit growth.
|
Selected Export Destinations
|
Year-on-year growth
|
|
Singapore
|
107.50%
|
|
Malaysia
|
106.87%
|
|
Spain
|
88.38%
|
|
South Africa
|
62.20%
|
|
Sri Lanka
|
60.42%
|
|
Hong Kong
|
47.61%
|
|
Japan
|
41.02%
|
|
China
|
37.71%
|
|
Germany
|
14.53%
|
|
USA
|
14.48%
|
|
UK
|
13.30%
|
Export Growth Beyond the Leading Markets
Trade expansion also reached markets beyond India’s largest export destinations. The regional picture reflects this wider reach.
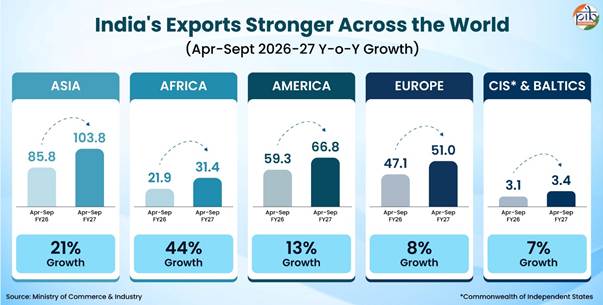
More Products Reaching New Markets
|
A new market is a product-country combination with exports recorded in April-September FY 2026-27 but none during the corresponding period last year.
|
India’s export reach also widened during April-September FY 2026-27, with 1,985 new product-market pairs generating US$ 622.1 million in exports. These covered 116 product groups across 229 countries and territories. Top 5 items under this include:
- Ships, boats and floating structures led with US$ 293.3 million, accounting for 47.2% of these exports.
- Silver contributed US$ 70.6 million, representing an 11.3% share.
- Wheat exports totalled US$ 61.3 million, accounting for 9.9% share.
- Railway equipment and parts contributed US$ 55.8 million, representing 9.0%, of total share.
- Motor vehicles and cars added US$ 9.5 million, or 1.5%.
|
Regional Specialities Find New Markets
Local produce is also reaching new destinations, taking India’s regional specialities to overseas buyers. Shipments in October 2026 illustrate this expanding reach:
Frozen foods: 24 tonnes shipped from Sonipat, Haryana, to Canada.
Organic palmyra jaggery powder: First shipment of 1.75 tonnes from Erode, Tamil Nadu, to Bulgaria.
Liquid glucose: First commercial shipment of 48 tonnes from Kanpur, Uttar Pradesh, to Vietnam.
Sinduri pomegranates: 1.3 tonnes exported from Kullu, Himachal Pradesh, to Dubai.
Kiwi: 1.5 tonnes shipped from Ziro, Arunachal Pradesh, to Dubai.
GI-tagged Tandur red gram: First shipment of 2.5 tonnes from Telangana to Australia.
GI-tagged Seoni Jumbo Sitafal: First shipment of approximately 1.25 tonnes from Madhya Pradesh to Sharjah, sourced from a self-help group.
|
Exports Strengthened Across Trade Agreement Partners
India’s exports also expanded across various trade-agreement partners during April-September FY 2026-27.
-
- Regional partnerships recorded strong growth, with exports to Association of Southeast Asian Nations (ASEAN) rising 58% and shipments to South Asian Free Trade Area (SAFTA) members increasing 22%.
- Singapore, Malaysia and Sri Lanka stood out among individual partner markets. Exports to Singapore more than doubled at 103%, followed by Malaysia at 83% and Sri Lanka at 73%.
- The expansion extended to other long-standing partners. Exports to Japan and South Korea rose 40% and 24%, respectively. Nepal, Bhutan and Thailand also recorded increases of 19%, 16% and 7%.
- Export Performance Across Recent Trade Agreements:
- Oman and Mauritius recorded the strongest increases among recent agreement partners, with exports growing 47% and 45%, respectively.
- Exports to Australia increased 11%, while the UK and European Free Trade Association (EFTA) recorded growth of 7% and 5%, respectively.
With India EU FTA coming into force early next year, Indian exports are all set to gain competitive advantage in a large trading block.
Exports within India’s Broader Economic Progress
India’s export growth complements the country’s broader economic progress, alongside strong domestic demand, improving employment conditions and a resilient external position.
A Strong Domestic Base
Real GDP grew 7.8% year-on-year in April-June FY 2026-27 , while the outlook for the financial year remains strong. The Reserve Bank of India, OECD, IMF and World Bank project growth of 7-7.1%, highlighting consumption, investment, exports and services as key drivers of economic momentum.
To read more about India’s GDP Performance in Q1 2026-27, please refer to India’s GDP Performance.
Poverty Reduction Over the Years
India’s economic progress is also reflected in falling poverty. According to the World Bank’s Poverty & Equity Brief (October 2026), the share of Indians living on less than US$ 4.20 a day fell from 57.7% in 2011 to 16.1% in 2023, bringing about 496 million people out of poverty. Over the same period, extreme poverty, i.e., living on less than US$3 a day, declined from 27.1% to 2.6%.
India’s Labour Market Shows Broad Improvement
Alongside this expansion, recent labour-market indicators show improving participation and employment.
|
Indicator
|
What the indicator denotes
|
Area
|
Apr-Jun 2026
|
Jul-Sept 2026
|
|
Labour Force Participation Rate (LFPR)
|
Measures the share of the population that is either working or seeking or available for work
|
Rural
|
56.9%
|
58.1%
|
|
Urban
|
50.2%
|
50.4%
|
|
Worker Population Ratio (WPR)
|
Measures the proportion of employed persons in the population
|
Rural
|
54.2%
|
55.6%
|
|
Urban
|
46.8%
|
46.9%
|
Additionally, unemployment among people aged 15 and above declined to 5.1% in July-September 2026, from 5.4% in April-June.
Women’s Participation Takes a Step Forward: Labour force participation among rural women rose from 37.2% in April-June to 39.2% in July-September 2026. Among urban women, it increased from 25.0% to 25.5% over the same period.
The improvement therefore extends beyond lower unemployment, with more people participating in the labour market and a greater proportion employed.
FDI Inflows and Forex Reserves
India’s external position also benefits from continued direct investment inflows and substantial reserves. Net foreign direct investment inflows rose to US$ 8.8 billion during April-September 2026 , from US$ 7.4 billion a year earlier. Foreign exchange reserves also stood at US$ 719.55 billion as of 6 November 2026, providing a sizeable external buffer.
Policy Support Sustaining India’s Export Momentum
|
Legal Foundation of India’s Foreign Trade
The Foreign Trade (Development and Regulation) Act, 1992 provides India’s legal framework for foreign trade.
|
India’s export policy supports businesses through duty relief, production support, local export development and targeted assistance. The Foreign Trade Policy (FTP) 2023, effective from 1 April 2023, provides the overarching framework for India’s exports and imports. The accompanying Handbook of Procedures (HBP) explains how its provisions are implemented.
Shaping Export Competitiveness
Supporting export production
FTP instruments facilitate access to inputs and equipment used in export production :
|
Scheme
|
Key Provisions
|
|
Advance Authorisation (AA)
|
Allows duty-free import of inputs physically incorporated into export products. 26,283 authorisations issued in FY 2025-26.
|
|
Duty Free Import Authorisation (DFIA)
|
Allows duty-free import of inputs on post-export basis. 3,579 authorisations issued in FY 2025-26.
|
|
Export Promotion Capital Goods (EPCG)
|
Allows capital goods imports at zero customs duty for pre-production, production and post-production. 21,838 authorisations issued in FY 2025-26.
|
Easing the domestic tax burden
Remission mechanisms address eligible taxes and levies embedded in exported products:
|
Scheme
|
Key Provisions
|
|
Remission of Duties and Taxes on Exported Products (RoDTEP)
|
Extended till 31.12.2026, it refunds unrebated taxes and duties on eligible exports by Domestic Tariff Area (DTAs) Units, AA holders, Special Economic Zone (SEZ) Units and Export Oriented Units (EOUs).
Exporters received ₹77,262.60 crore in benefits during April 2021-December 2025.
|
|
Rebate of State and Central Taxes and Levies (RoSCTL)
|
Extended till 31.12.2026, it refunds unrebated State and Central taxes and levies on apparel and made-ups. The Scheme benefited 15,400+ exporters across 444+ districts, predominantly MSMEs, in FY 2025-26.
|
Broadening export participation: Taking Local Enterprises Global
Various policy and facilitation measures have been undertaken to support exports by MSMEs, startups, artisans and small exporters.
- Districts as Export Hubs (DEH) : The DEH initiative makes each district a unit of export planning, helping local enterprises build competitiveness and access global markets. Aligned with Aatmanirbhar Bharat and Vocal for Local, it supports district-led growth.
As of March 2026, draft plans covered 590 districts, with 249 formally adopted by District Export Promotion Committees.
To read more on DEH, please refer to Districts as Export Hubs: Taking India's Exports to Every District
- E-Commerce Exports: The FTP provides a framework for cross-border trade of goods and services in the digital economy, promoting e-commerce and emerging export channels. One such framework envisages E-Commerce Export Hubs (ECEHs) as centres providing business infrastructure and facilities for cross-border e-commerce.
Export Promotion Mission (EPM): An Integrated Push
Approved in November 2025, EPM has an outlay of ₹25,060 crore for FY 2025-26 to FY 2030-31 to strengthen export competitiveness, expand exports and generate employment. It combines financial and non-financial support across trade finance, compliance, market access and logistics. The Scheme focuses on MSMEs, first-time exporters, labour-intensive sectors and exporters in interior and low-export regions.
Support During Trade Disruptions: The Resilience & Logistics Intervention for Export Facilitation (RELIEF) has a ₹497 crore outlay under EPM, particularly supporting MSMEs. The component provides covers for higher freight costs, insurance premiums and war-related risks from Gulf-West Asia maritime disruptions. It covers both eligible past shipments and prospective exports.
To read more on EPM, please refer to Export Promotion Mission: Building an Integrated Pathway for MSMEs in Global Trade
Unlocking Overseas Markets: Rising Trade Partnerships
India’s expanding trade partnerships are widening market access and strengthening economic resilience amid global challenges.
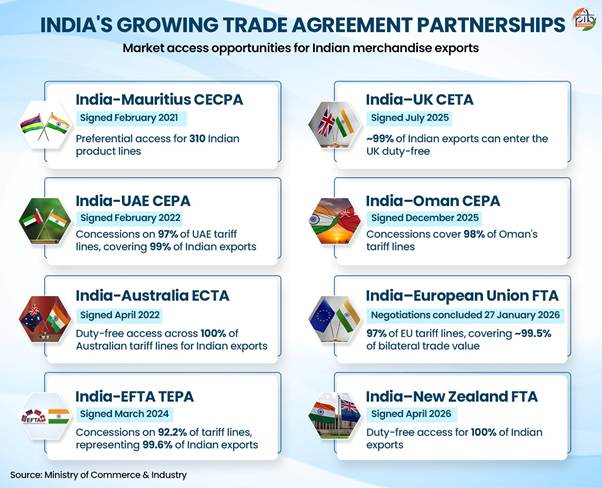
The Evolving Landscape of India’s Trade Partnerships: Alongside implementing recent agreements, India is pursuing nine trade negotiations to expand its global reach. This includes talks with the US, Canada, Gulf Cooperation Council (GCC) and others. Additionally, four review or upgrade negotiations are also underway, including the India-Korea CEPA and ASEAN-India Trade in Goods Agreement.
To read more on India’s Trade Partnerships, please refer to Signed, Sealed and Exporting: India’s Trade Agreements in Action
Special Economic Zones (SEZs): Expanding Export Infrastructure
SEZs are designated areas that promote trade and investment. They support exports by attracting domestic and foreign investment, developing infrastructure and enabling industrial activity. These zones also generate foreign exchange and create direct and indirect employment, supporting local businesses and economies. As on July 2026, a total of 372 SEZs have been notified. Eight new SEZs were notified during FY 2026-27.
|
Entity
|
Sector
|
Location
|
Proposed investment (~₹ crore)
|
Proposed direct/indirect employment (approx.)
|
|
Tata Semiconductor Manufacturing Private Limited
|
Electronic hardware and software, including IT/ITES
|
Dholera Special Investment Region, Gujarat
|
91,000
|
21,900
|
|
NDR Infrastructure Private Ltd
|
Multi-sector
|
Ranipet district, Tamil Nadu
|
316.1075
|
1,000
|
|
Pondicherry Industrial Promotion Development and Investment Corporation (PIPDIC)
|
Multi-sector
|
Puducherry district, Puducherry (UT)
|
1,250
|
5,000
|
|
Oulgaret Municipality SEZ
|
IT/ITES
|
Puducherry district, Puducherry (UT)
|
725
|
3,500
|
|
Cognizant Technology Solutions India Private Limited
|
IT/ITES
|
Visakhapatnam, Andhra Pradesh
|
1,582.98
|
17,302
|
|
Heterogeneous Integration Packaging Solutions Private Limited
|
Semiconductor
|
Khordha, Jatni, Odisha
|
297.39
|
250
|
|
Polymatech Electronics Limited
|
Electronics and engineering—semiconductor and electronics manufacture
|
Nava Raipur, Atal Nagar, Chhattisgarh
|
130
|
1,300
|
|
NIDP Developers Private Limited
|
IT/ITES SEZ for data centre development
|
Greater Noida, Gautam Buddha Nagar district, Uttar Pradesh
|
2,448.66
|
166
|
To read more on SEZs, please refer to: Union Budget 2026–27: Strengthening SEZs for Global Competitiveness & Growth.
Streamlining Export Delivery
India is strengthening export delivery through digital services, simpler customs procedures and better access to logistics infrastructure.
|
 Trade Connect is designed to empower Indian exporters by bringing international trade information and services into one place, easing access to global markets.
|
|
 ICEGATE (Indian Customs Electronic Data Interchange (EDI) Gateway) connects Indian Customs and traders through a single digital gateway, simplifying customs procedures and facilitating cross-border trade.
|
|
 Unified Logistics Interface Platform (ULIP) integrates government logistics systems through APIs. By July 2026, ULIP linked 46 systems across 12 Central Ministries through 142 APIs.
|
|
 Logistics Data Bank (LDB) tracks EXIM containers in real time, improving information exchange and logistics visibility.
|
|
 Dak Ghar Niryat Kendras (DNKs) simplify postal exports through booking, digital documentation and customs clearance. As of January 2026, 1,013 DNKs are operational nationwide, helping exporters in remote areas reach global markets.
|
Broader Policy Framework Supporting Export Growth
India’s export growth is reinforced by Make in India, Production Linked Incentive (PLI) schemes and PM MITRA Parks, which strengthen manufacturing capabilities and export capacity.
These efforts are complemented by the National Logistics Policy, PM GatiShakti and Sagarmala, which support better connectivity and lower logistics costs to strengthen export competitiveness.
Conclusion
India’s recent export performance reflects growth in both merchandise and services, with gains extending across products and partner countries. This expansion draws on the collective efforts of exporters, MSMEs, traders and the government to strengthen competitiveness and reach new buyers. These efforts are backed by consistent policy support through manufacturing incentives, market-access assistance and logistics initiatives.
Additionally, measures to simplify trade, improve connectivity and help businesses enter new markets continue to reinforce this support. These measures will further support Indian enterprises to build their reach across wider markets.
References
Ministry of Commerce & Industry
https://www.commerce.gov.in/files/2026-04/Annual_0.pdf
https://www.pib.gov.in/PressReleasePage.aspx?PRID=2290437&lang=1®=3
https://content.dgft.gov.in/Website/om199.htm
https://content.dgft.gov.in/Website/Chapter_1_Revised_FTP_v1.2.2.pdf
https://content.dgft.gov.in/Website/dgftprod/a11b458e-0d61-460f-aef4-b201ed40a9aa/FTP2023_Chapter04.pdf
https://content.dgft.gov.in/Website/dgftprod/9f6336a2-e03d-4dbb-86eb-305615f0db13/FTP2023_Chapter05.pdf
https://www.pib.gov.in/PressReleasePage.aspx?PRID=2318052&lang=1®=3
https://www.commerce.gov.in/files/2026-04/Annual_0.pdf
https://www.pib.gov.in/PressReleasePage.aspx?PRID=2317338&lang=2®=48
https://www.pib.gov.in/PressReleasePage.aspx?PRID=2287009&lang=1®=3
https://www.pib.gov.in/PressReleasePage.aspx?PRID=2305826&lang=1®=3
https://content.dgft.gov.in/Website/Chapter%209%20FTP%20eCommerce.pdf
https://www.dgft.gov.in/CP/index.jsp?opt=export-promotion-mission
https://www.pib.gov.in/PressReleasePage.aspx?PRID=2242410&lang=1®=3
https://www.trade.gov.in/pages/about-trade-connect-eplatform
https://static.pib.gov.in/WriteReadData/specificdocs/documents/2026/nov/doc_10476_20261113_22550501.pdf
https://www.sezindia.gov.in/sites/default/files/approved_sez/State%20wise%20distribution%20of%20SEZs%20upto%2031.07.2026.pdf
Ministry of Statistics & Programme Implementation
https://www.pib.gov.in/PressReleseDetailm.aspx?PRID=2304949&lang=2®=48
https://www.pib.gov.in/PressReleseDetailm.aspx?PRID=2334642&lang=1®=1
https://static.pib.gov.in/WriteReadData/specificdocs/documents/2026/oct/doc_10178_20261015_12230801.pdf
Ministry of Communications
https://www.pib.gov.in/PressReleasePage.aspx?PRID=2216466&lang=1®=3
Niti Aayog
https://www.niti.gov.in/sites/default/files/2025-07/Trade-Watch-Quarterly.pdf
https://www.niti.gov.in/sites/default/files/2026-06/Trade-Watch-Quarterly-Jan-March-Q4-FY26.pdf
Reserve Bank of India (RBI)
https://www.rbi.org.in/scripts/BS_PressReleaseDisplay.aspx?prid=63742
https://www.rbi.org.in/Scripts/BS_PressReleaseDisplay.aspx?prid=63403
World Bank
https://www.worldbank.org/en/news/press-release/2026/10/06/india-development-update-oct-2026
https://www.worldbank.org/en/news/press-release/2026/10/06/india-development-update-oct-2026
https://www.worldbank.org/en/news/press-release/2026/04/09/india-remains-among-the-fastest-growing-economies
https://documents1.worldbank.org/curated/en/099722104222534584/pdf/IDU-25f34333-d3a3-44ae-8268-86830e3bc5a5.pdf
International Monetary Fund (IMF)
https://www.imf.org/-/media/files/publications/weo/2026/october/english/text.pdf
https://www.imf.org/en/publications/weo/issues/2026/07/08/world-economic-outlook-update-july-2026
Organisation for Economic Co-operation and Development (OECD)
https://www.oecd.org/content/dam/oecd/en/publications/reports/2026/09/oecd-economic-outlook-interim-report-september-2026_8312492f/f751d02b-en.pdf
https://www.oecd.org/content/dam/oecd/en/publications/reports/2026/06/oecd-economic-outlook-volume-2026-issue-1_8be0dba6/2d1956f0-en.pdf
Asian Development Bank (ADB)
https://www.adb.org/sites/default/files/publication/1155601/asian-development-outlook-july-2026.pdf
PIB Archives
https://www.pib.gov.in/PressNoteDetails.aspx?ModuleId=3&NoteId=158804&lang=1®=3
https://www.pib.gov.in/PressNoteDetails.aspx?ModuleId=3&NoteId=160423&lang=1®=3
https://static.pib.gov.in/WriteReadData/specificdocs/documents/2026/aug/doc2026818961401.pdf
https://static.pib.gov.in/WriteReadData/specificdocs/documents/2026/oct/doc_10178_20261015_12230801.pdf
https://static.pib.gov.in/WriteReadData/specificdocs/documents/2026/mar/doc2026328835301.pdf
https://static.pib.gov.in/WriteReadData/specificdocs/documents/2026/mar/doc2026314824001.pdf
See in PDF
***
PIB Research